Helping businesses pinpoint bias in recruiting

Team Dandi – Jan 18th, 2023
With Dandi’s latest product release, there’s nowhere for recruiting bias to hide.
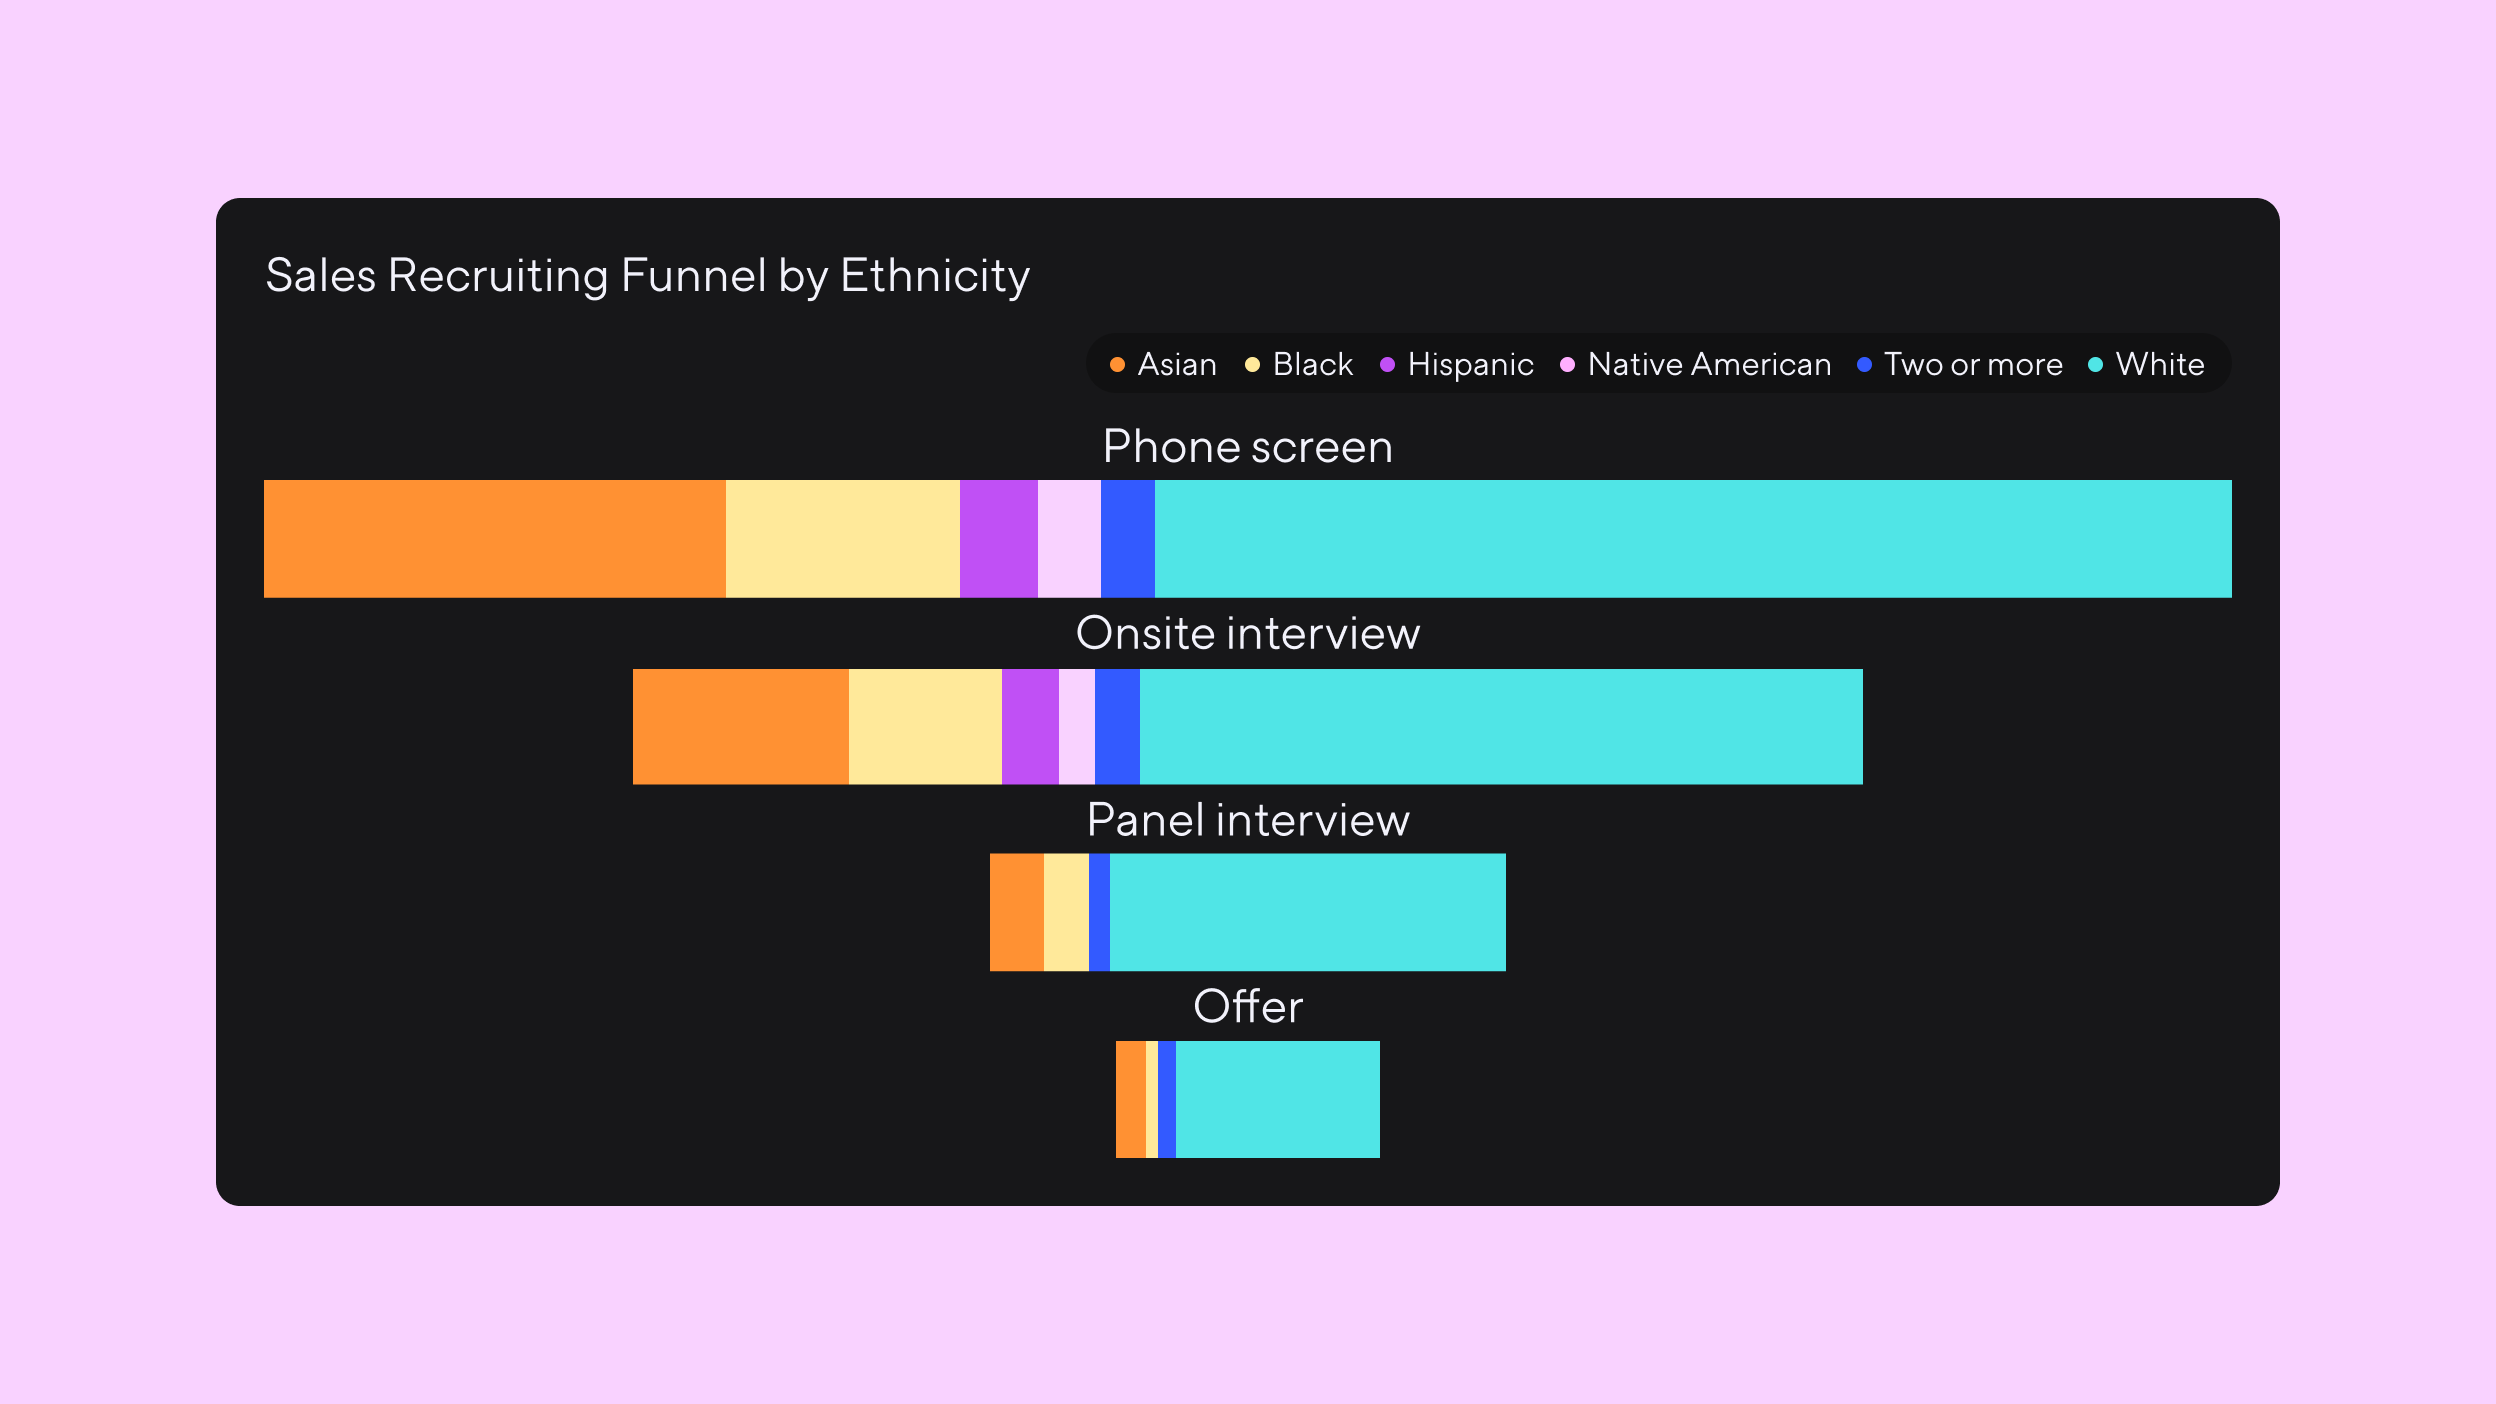
Dandi's recruiting funnel analysis shows how candidates of different genders and ethnicities move through your recruiting process.
Recruiting is one of the most important levers companies have for advancing Diversity, Equity, and Inclusion.
Recruiting establishes the demographics of a workforce and sets the baseline for employees’ compensation, job level, and more. Most companies today, however, lack the ability to analyze their recruiting efforts through the lens of DEI.
Dandi’s latest product release is set to change that.
As part of our ongoing efforts to help businesses around the world advance their DEI efforts, Dandi is announcing new recruiting metrics and a new recruiting funnel analysis designed to pinpoint and eliminate bias in recruiting.
New recruiting funnel analysis
Many companies today are focused on increasing their pipeline of underrepresented candidates. While pipeline is incredibly important, it is only one part of the recruiting journey.
In order to build a more diverse workforce, companies need to also ensure that candidates are moving equitably through the entire recruiting process.
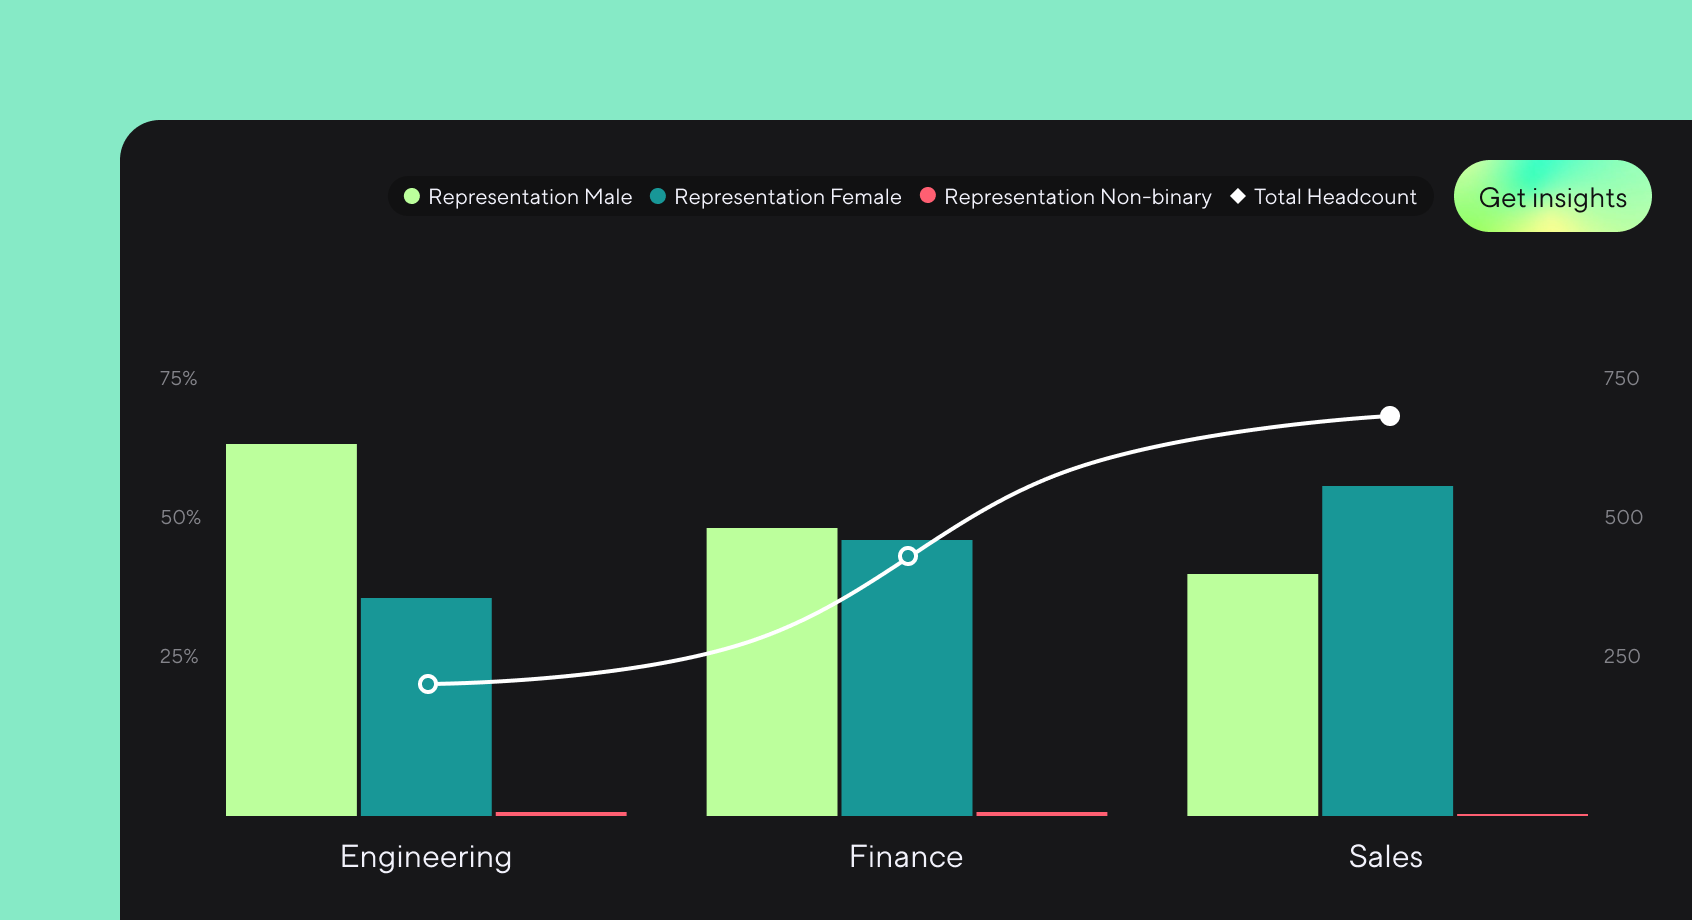
Dandi’s new recruiting funnel analysis shows how candidates move through each stage of the recruiting journey, making it easier for companies to see which candidate groups are advancing—and which groups aren’t.
How it works
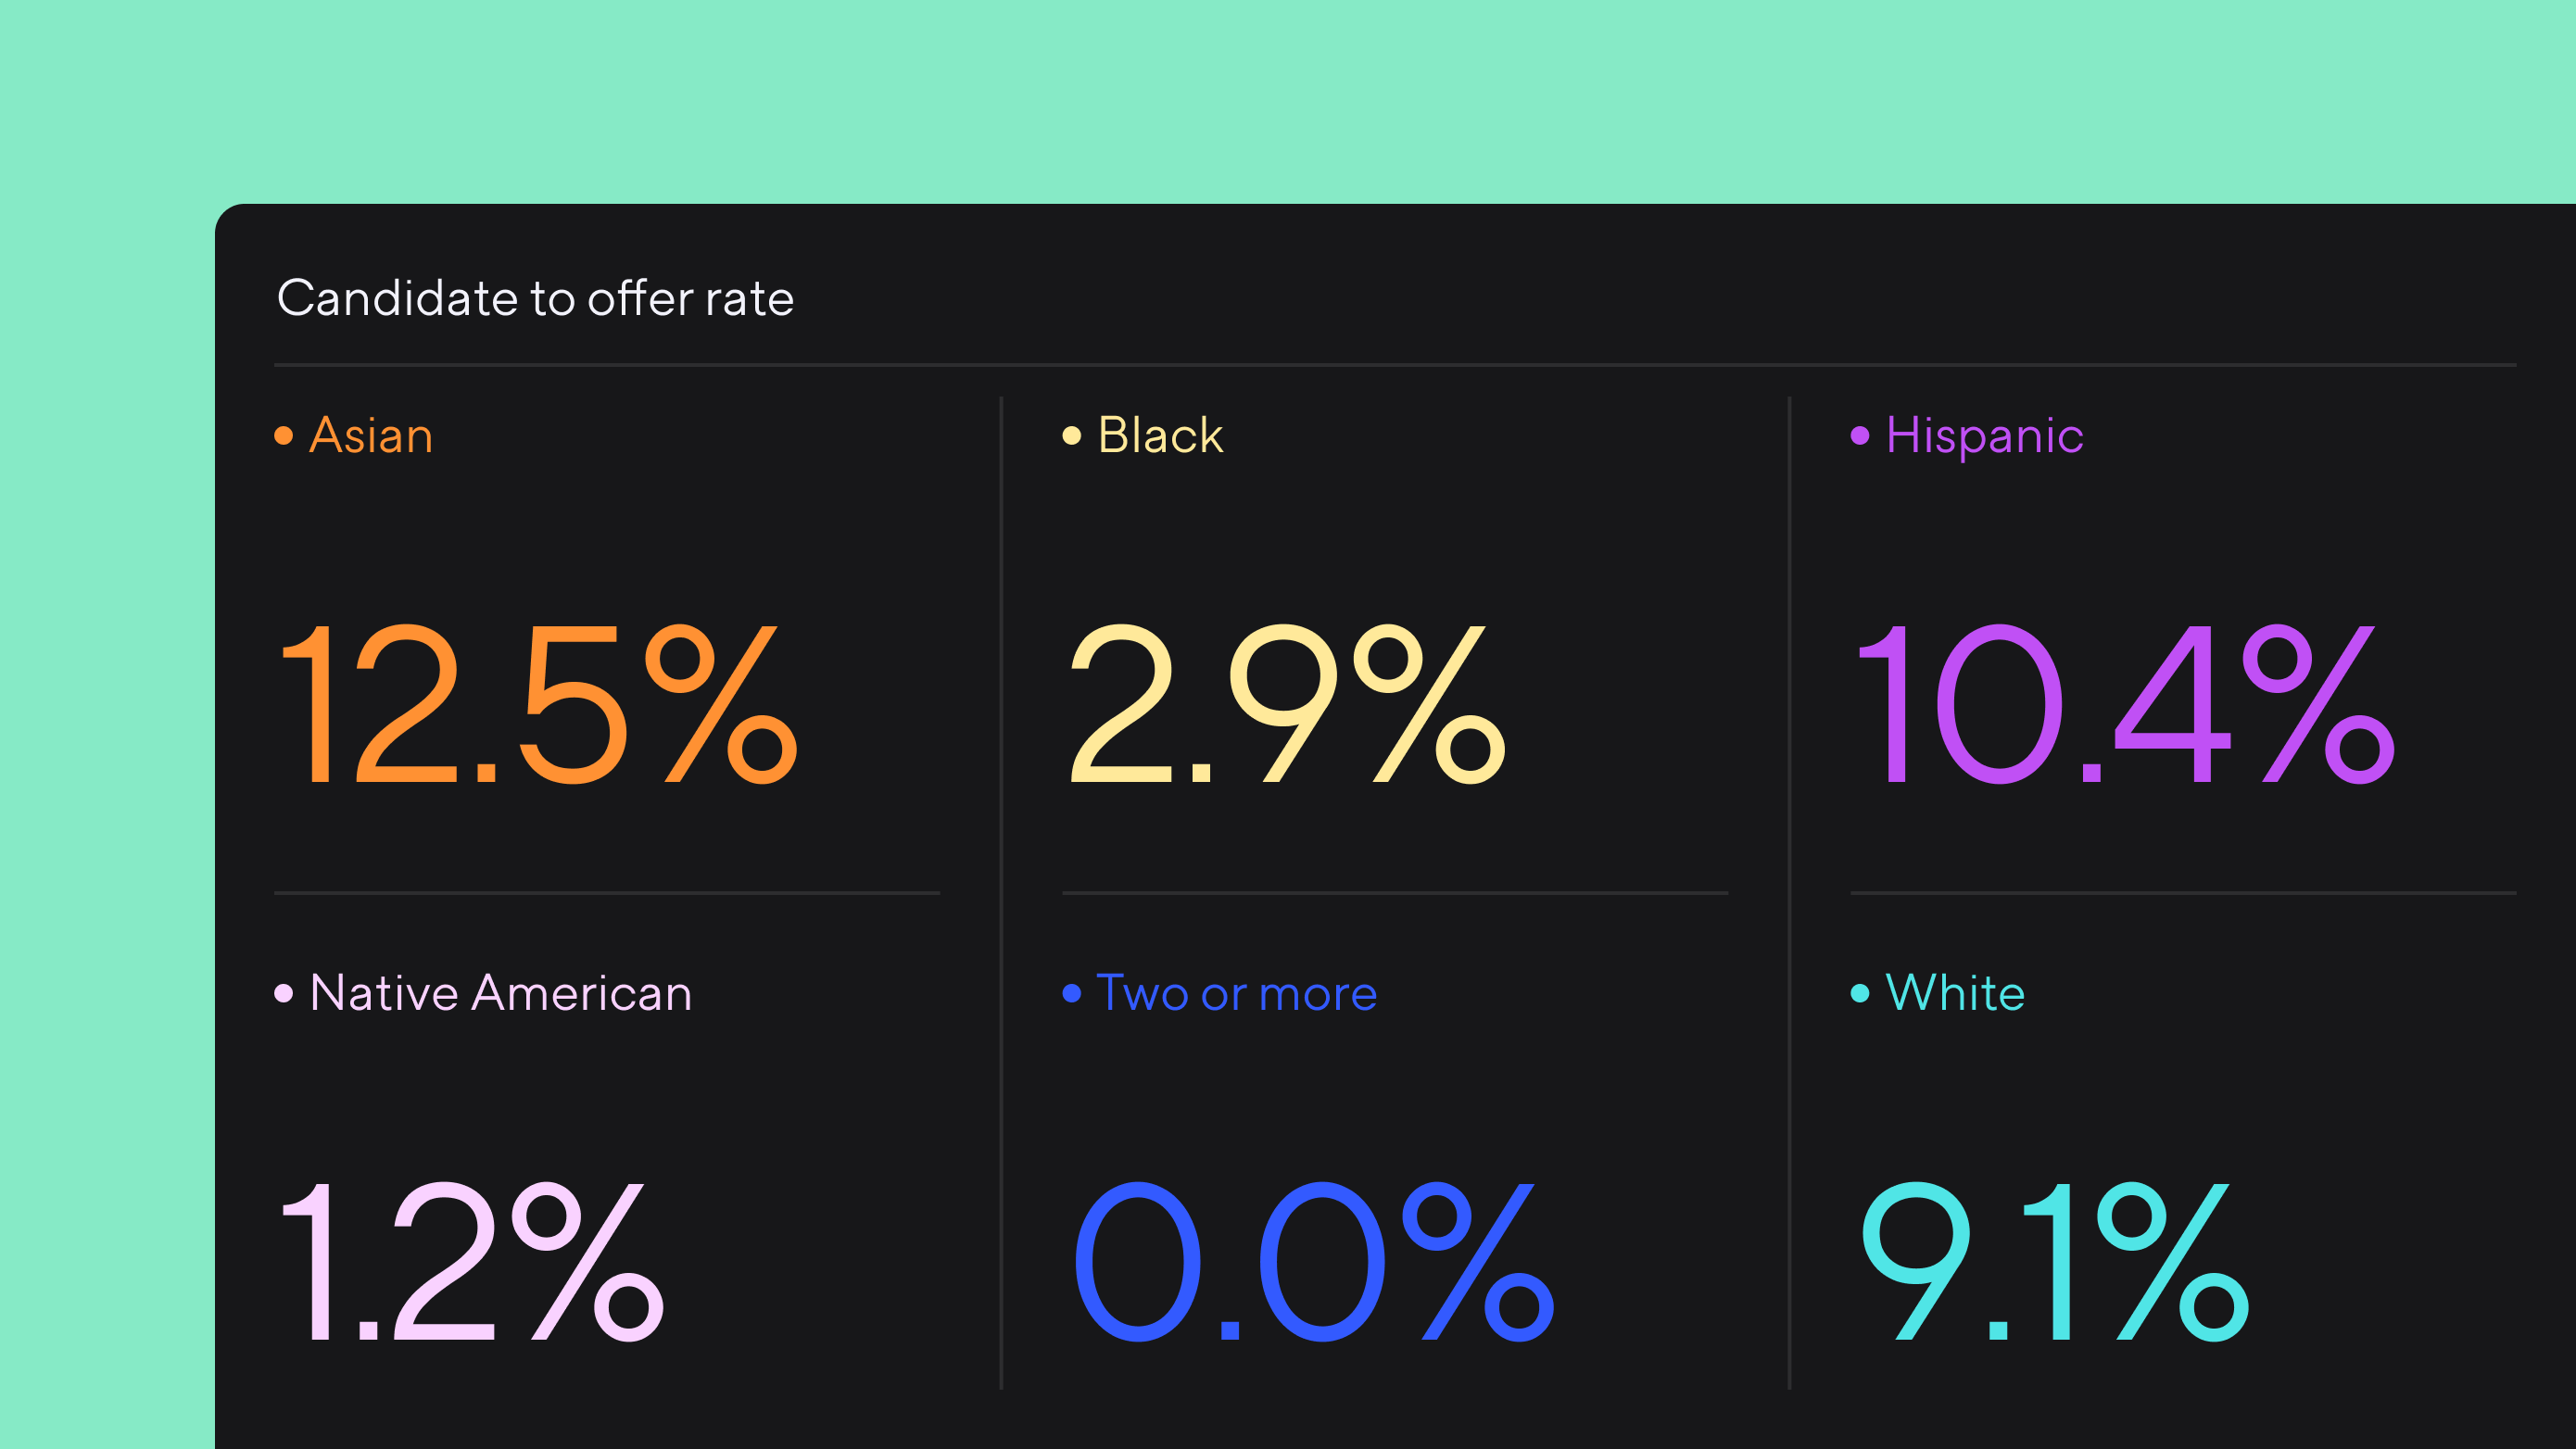
Recruiting funnel analysis shows two primary metrics:
- Pass-through rates from stage to stage
- Representation numbers within each stage, segmented by available attributes such as gender and ethnicity
Taken together, these metrics can show if and where bias occurs throughout the recruiting funnel.
For instance, businesses can see if men are advancing through the phone screen stage at higher rates than women, or if Asian candidates receive offer letters at rates disproportionately higher than White or Black candidates.
Because each company defines its recruiting funnel differently, Dandi customers will set the stages of their funnel during implementation. Customers can also establish separate funnels for specific departments or roles as needed.
Why it matters
If certain applicant groups are not being passed through your recruiting process, there's a problem.
By showing the exact spots at which bias occurs, businesses can use Dandi to implement targeted fixes, rather than continuing to push candidates into a biased process. With a better understanding of how different candidates move through their recruiting journey, businesses can also set and support more targeted, data-driven goals for hiring and DEI.

This latest release from Dandi can help break down the real barriers to building more diverse teams: systemic inequities and bias in hiring.
Carol WatsonChief Inclusion Officer, BCW Global
New recruiting metrics
Dandi is also expanding the number of recruiting-specific metrics available through the platform. Here is a sample of the standard recruiting metrics that we’ll initially introduce:
- Number of job openings, number of applicants, number of hires
- Offers extended, offers accepted, offer rate, offer acceptance rate
- Average time to hire, average time to rejection
- Applicants per job opening, distribution of applicants by source, distribution of hires by source
Each of the above metrics can be segmented across any attribute you have in your ATS, including gender, ethnicity, department, location, and source.
We can also now create any number of custom recruiting metrics based on customer needs.
How it works
The new recruiting metrics can be accessed within the Explore tab of Dandi, alongside the rest of the analyses we offer. Recruiting reports can be saved and added to dashboards just like any of our other reports.
Why it matters
Recruiting metrics are one of our most-requested features. And for good reason: while businesses can find some of this information in their ATS, it’s often impossible to add an intersectional lens to this data. And DEI doesn’t work without intersectional measurement.
With today’s announcement, businesses everywhere can now view their recruiting process through the lens of intersectional measurement, providing an immediate view of what different candidate groups experience throughout the recruiting process.
Integrations
Dandi integrates with many popular ATS providers like Greenhouse. To view our full list of integrations, click here.
Getting started
We’re excited about this product launch, and excited to see how businesses use it.
Existing Dandi customers can contact their customer success rep to get the new recruiting features added to their account.
For new customers, recruiting analysis and metrics will be available through Dandi’s Plus and Premium plans. View the Pricing page to learn more.
Interested in learning more about our new recruiting features? Book a demo to see what Dandi can do.
More from the blog
Announcing more powerful Dandi data visualizations
Team Dandi - Oct 23rd, 2024
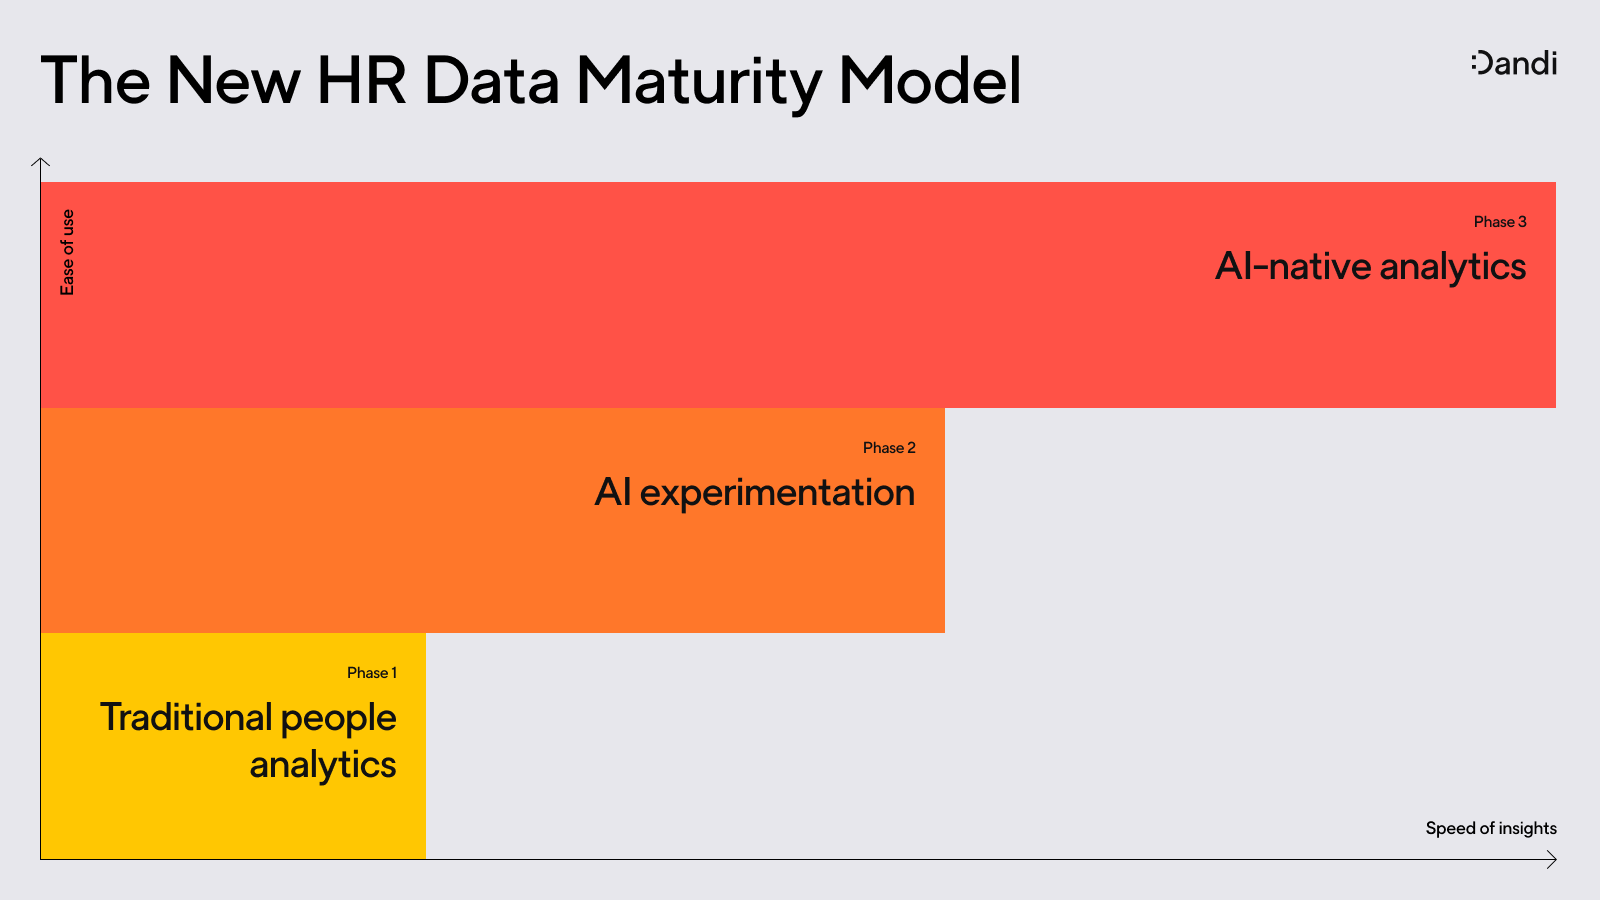
The New Maturity Model for HR Data
Catherine Tansey - Sep 5th, 2024
Buyer’s Guide: AI for HR Data
Catherine Tansey - Jul 24th, 2024
Powerful people insights, 3X faster
Team Dandi - Jun 18th, 2024
Dandi Insights: In-Person vs. Remote
Catherine Tansey - Jun 10th, 2024
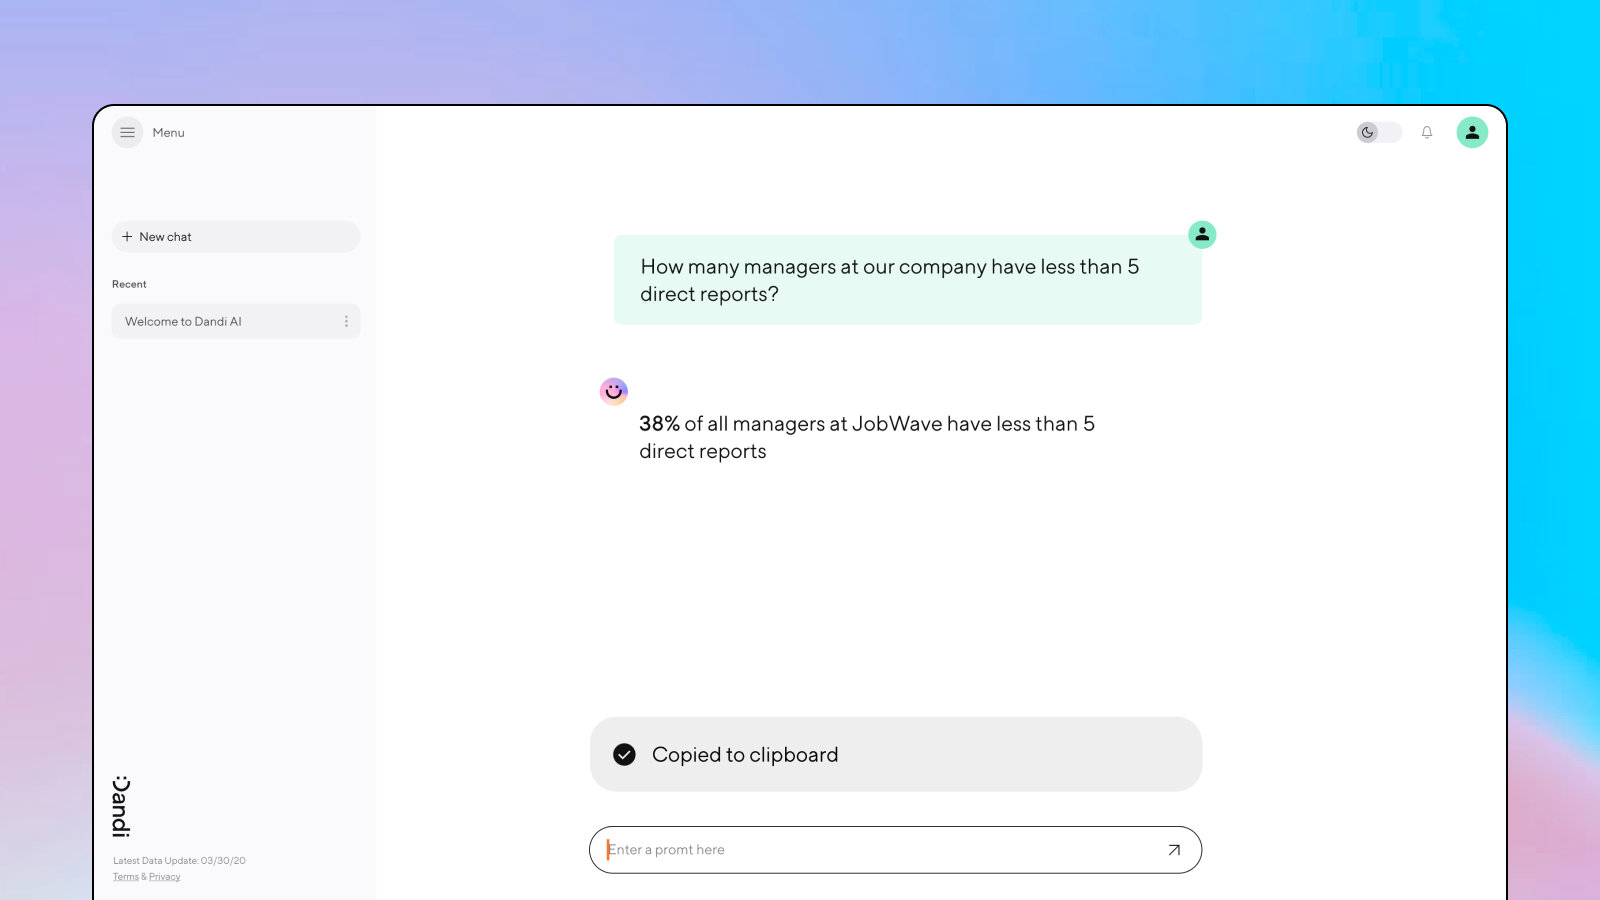
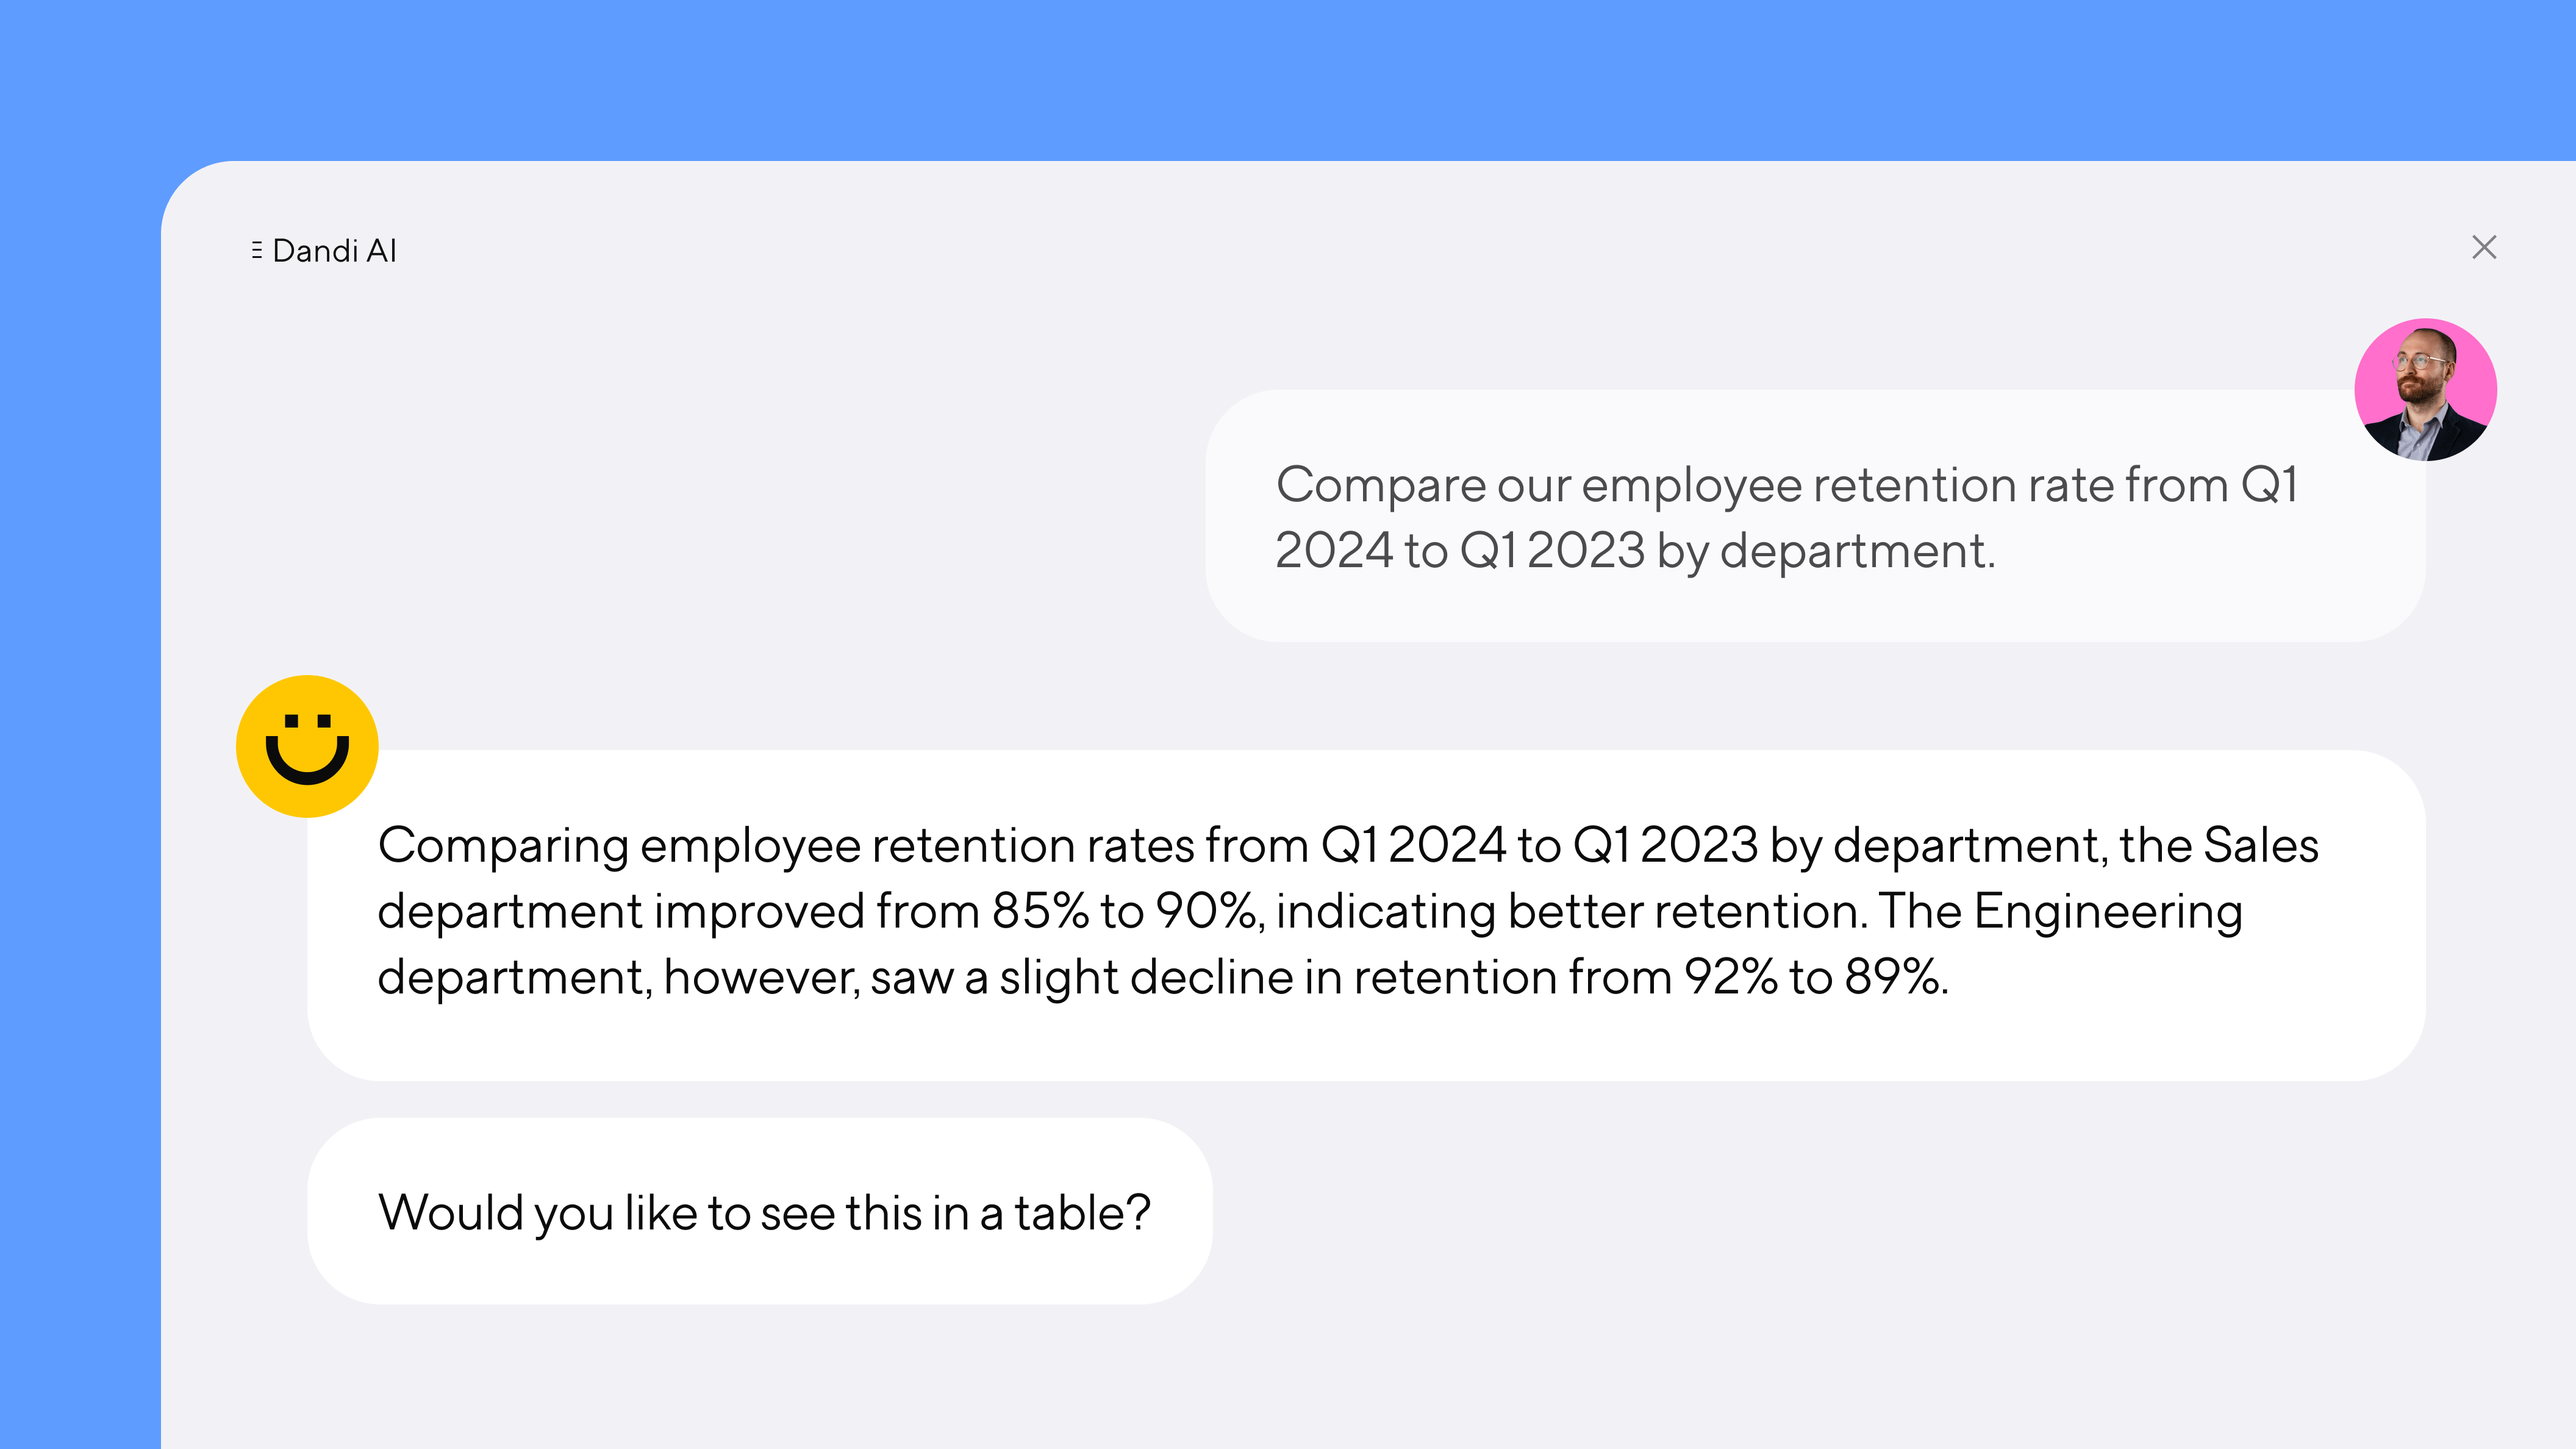
Introducing Dandi AI for HR Data
Team Dandi - May 22nd, 2024
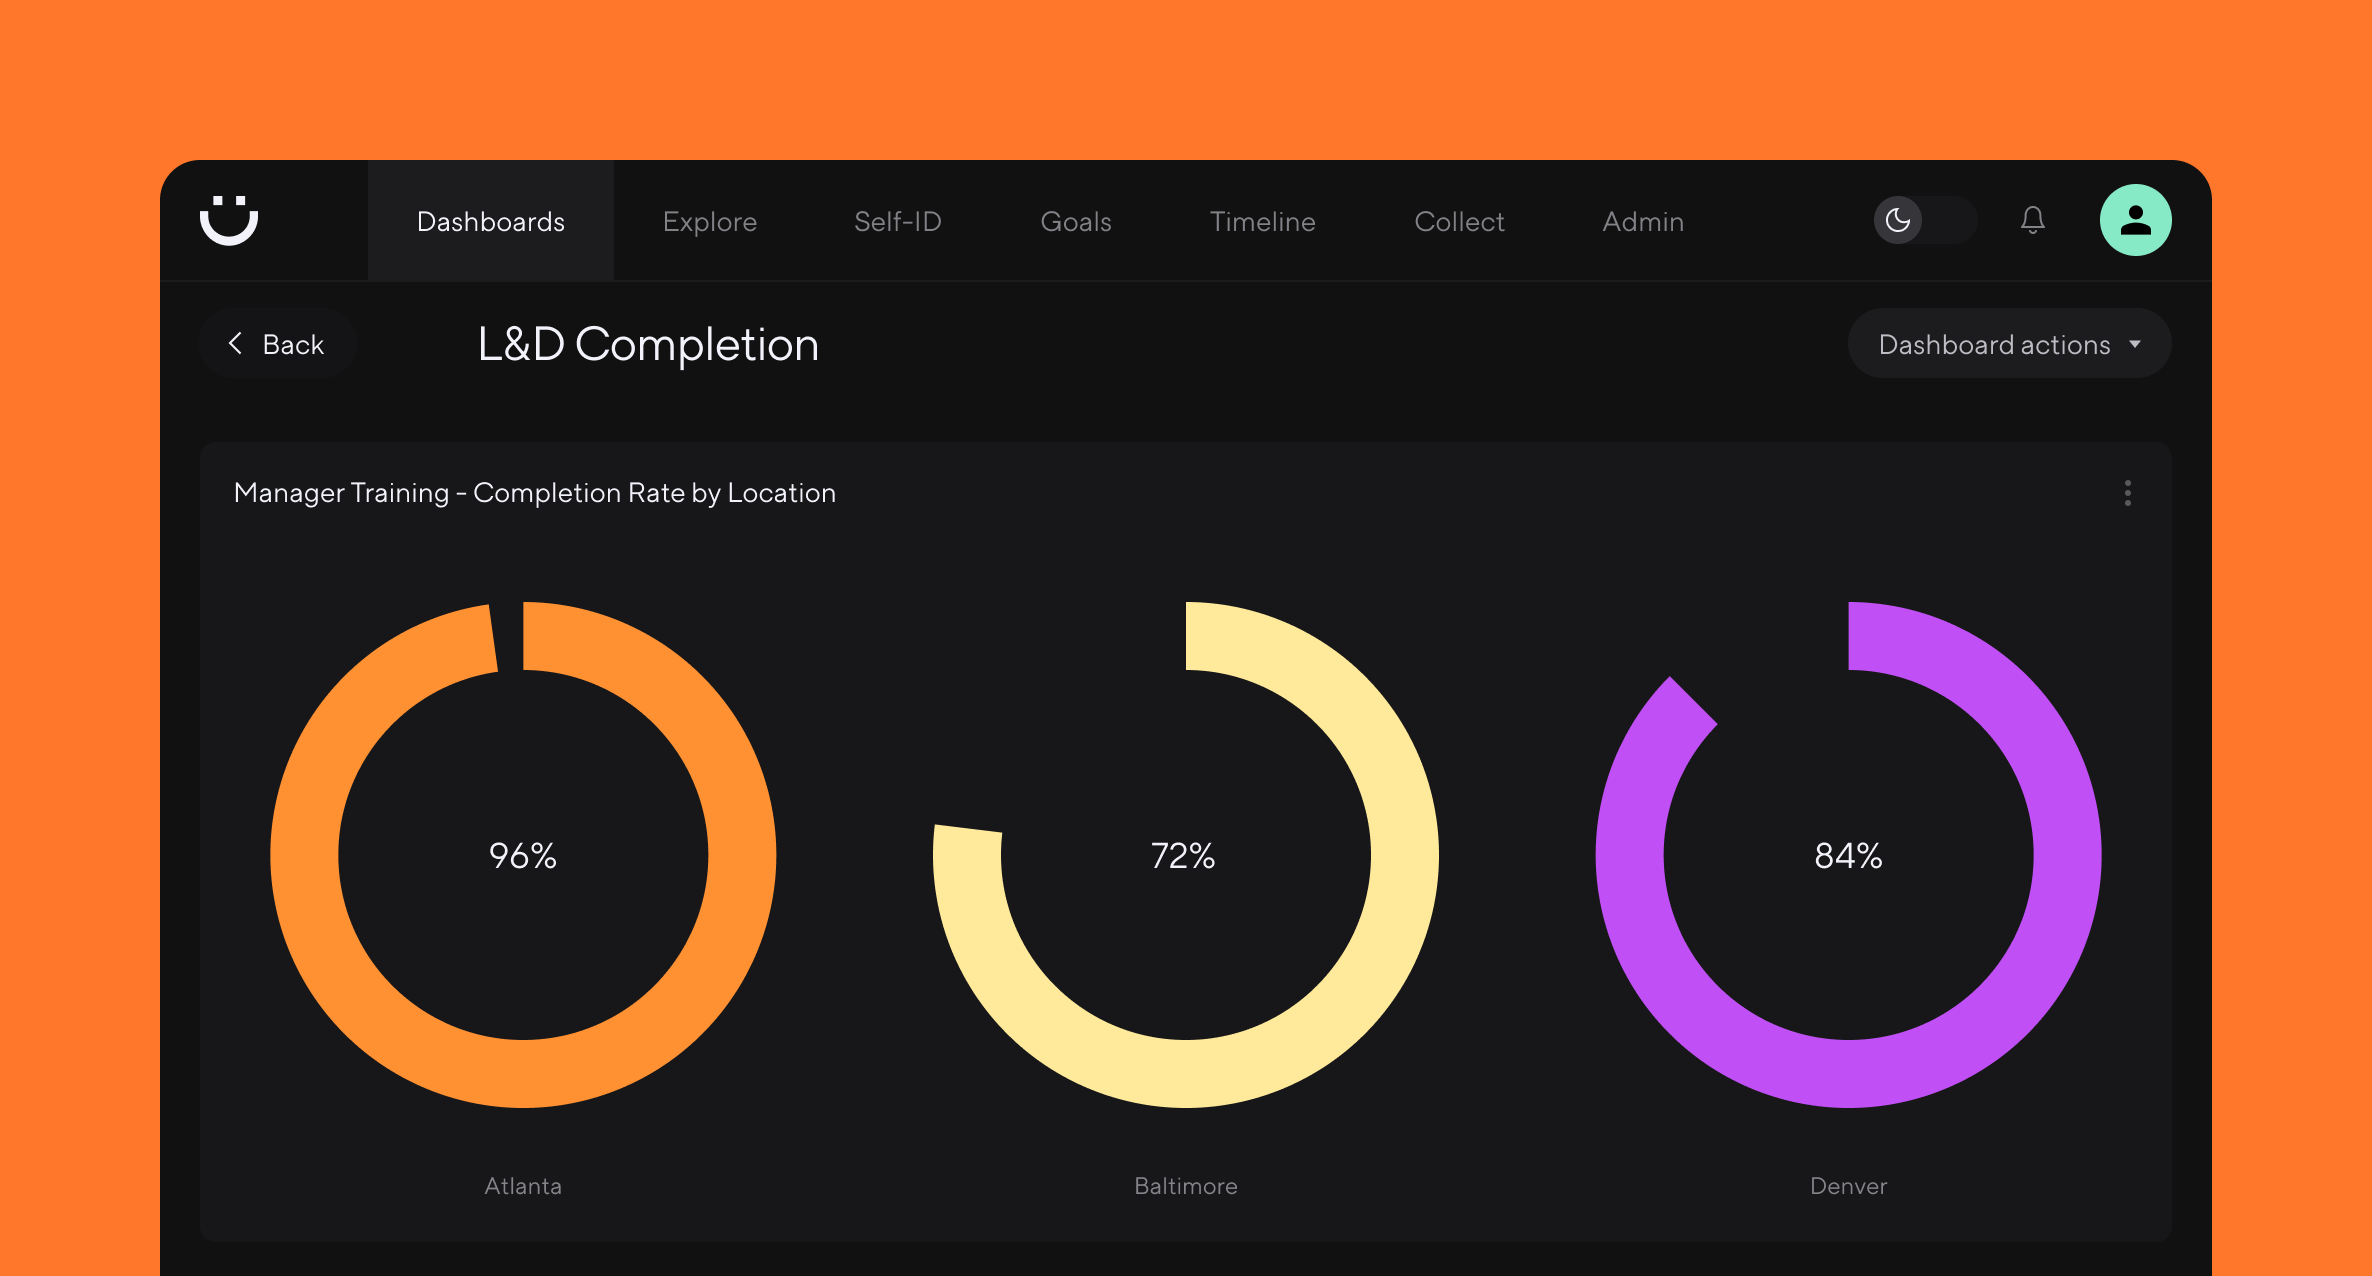
5 essential talent and development dashboards
Catherine Tansey - May 1st, 2024
The people data compliance checklist
Catherine Tansey - Apr 17th, 2024
5 essential EX dashboards
Catherine Tansey - Apr 10th, 2024
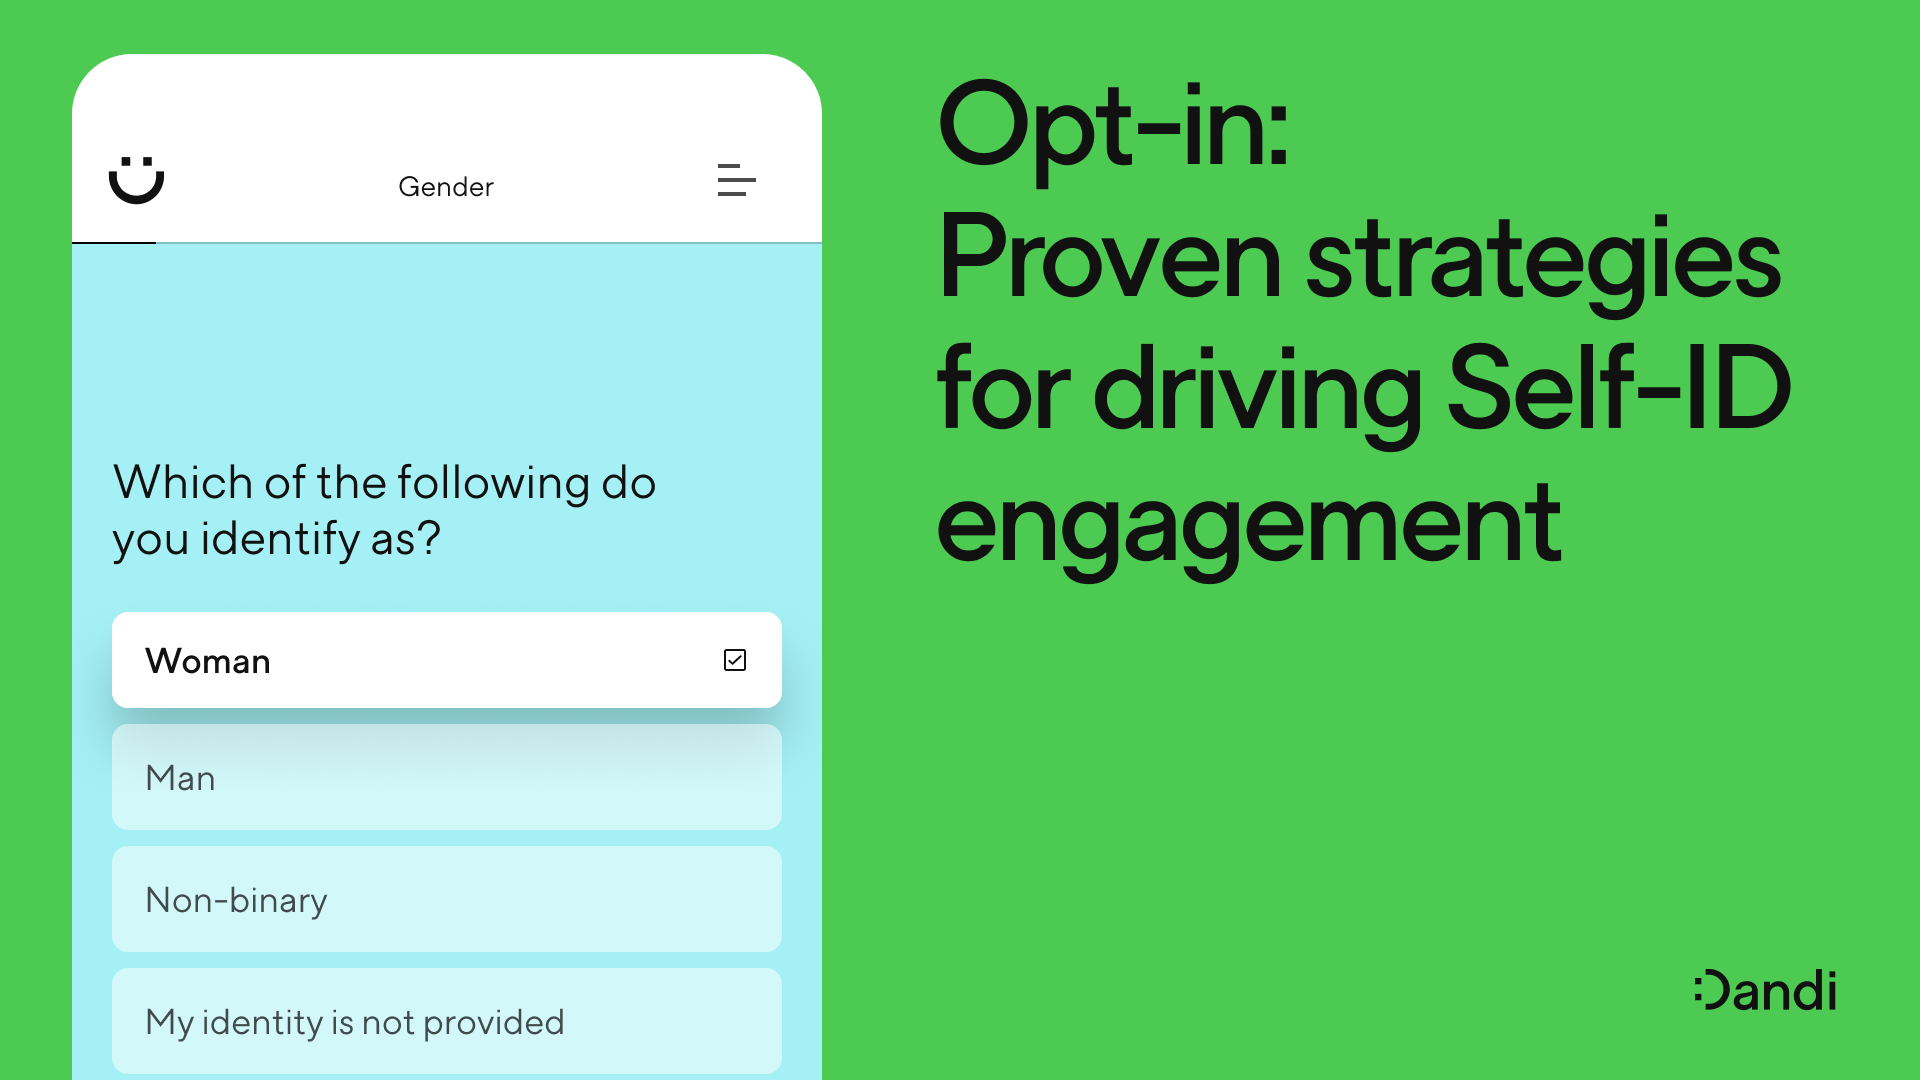
Proven strategies for boosting engagement in self-ID campaigns
Catherine Tansey - Mar 27th, 2024