5 essential DEI dashboards
Catherine Tansey – Feb 22nd, 2024
Learn how to track the metrics that matter for your DEI initiatives.
Despite a growing chorus of backlash in a post-Affirmative Action United States, DEI remains a top priority for many CEOs. While some companies have rearranged the acronym—one company now uses IE&D—or scrapped it all together, a majority of executives remain committed to the cause. Employment law firm Littler found that 57% of executives surveyed in November 2023 said their companies had expanded DEI programs in the last year.
As you revisit your DEI strategy for 2024, here are the top metrics you should be tracking.
Representation
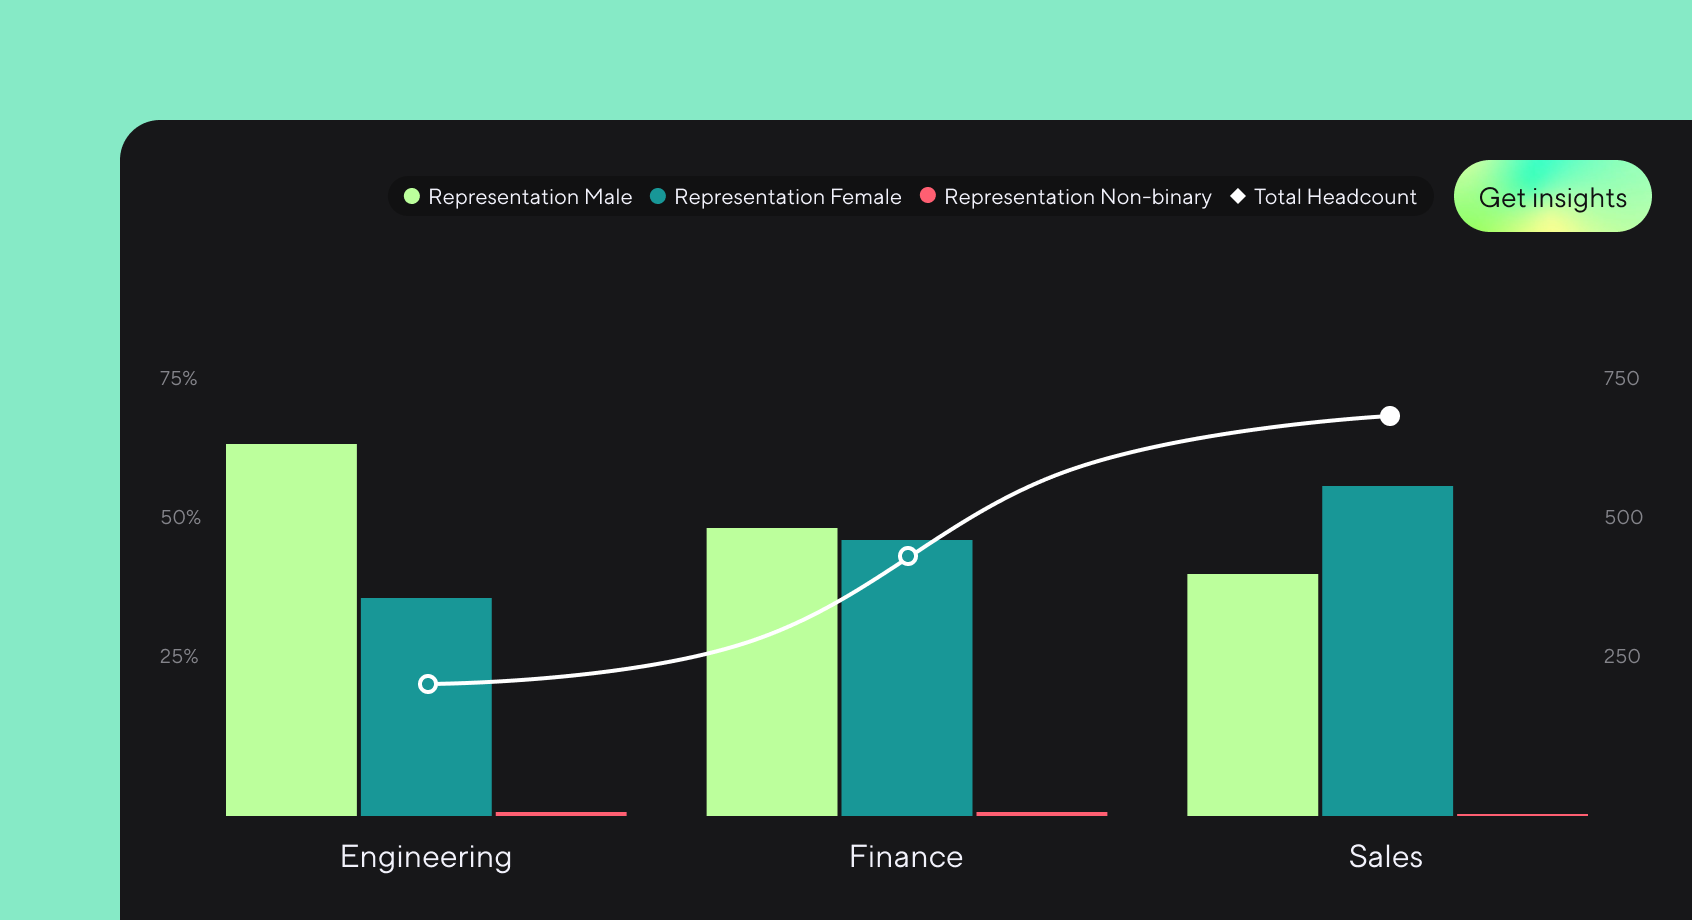
Race and gender tend to dominate the conversation around workplace representation, but they’re only two dimensions of diversity in the workforce. Companies should be tracking age, gender, ethnicity, and disability-, veteran-, and neuro-status for a more honest snapshot of representation.
Plus, tracking additional dimensions of diversity enables companies to take an intersectional approach, allowing you to better correct for structural disadvantages.
For example, common knowledge tells us that men fare better in the workplace, but in their recent book Getting to Diversity, sociologists Frank Dobbin and Alexandra Kalev found that isn’t always the case. The two analyzed data from the federal government to chart the progress of management diversity over time.
Their research shows that at the current rate to catch up with the numbers of white men in management, it would take Black women two centuries and Latina women one century. When it comes to Black and Latino men, Dobbin and Kalev found that at today’s rate they would never catch up.
Race and gender tend to dominate the conversation around workplace representation, but they’re only two dimensions of diversity in the workforce.
Tracking representation isn’t so simple as looking at gender or race. As Dobbin and Kalev demonstrate, some men—white men—fare better in the workplace than others.
Beyond dimensions of diversity, you should also slice the data across the org itself, looking for more strategic insights by examining representation across job level, office location, department, manager, and more. Otherwise, you may make superficial observations that don’t accurately reflect your company’s DEI reality, says DEI and People specialist Catalina Colman.
“I used to work at a women-led organization, and it was very easy to make the assumption that we were gender diverse,” she says. “When we dug beneath the surface and really started to look at the data, we found that women were at the top of the organization and in entry-level positions, but we didn’t have many women in middle management,” she adds.
Armed with accurate insights, Colman and her team dove even further into the data, looking at job leveling, career progression tracks, and performance reviews before creating and implementing strategies to help the company move closer to its DEI goals.
Pay equity
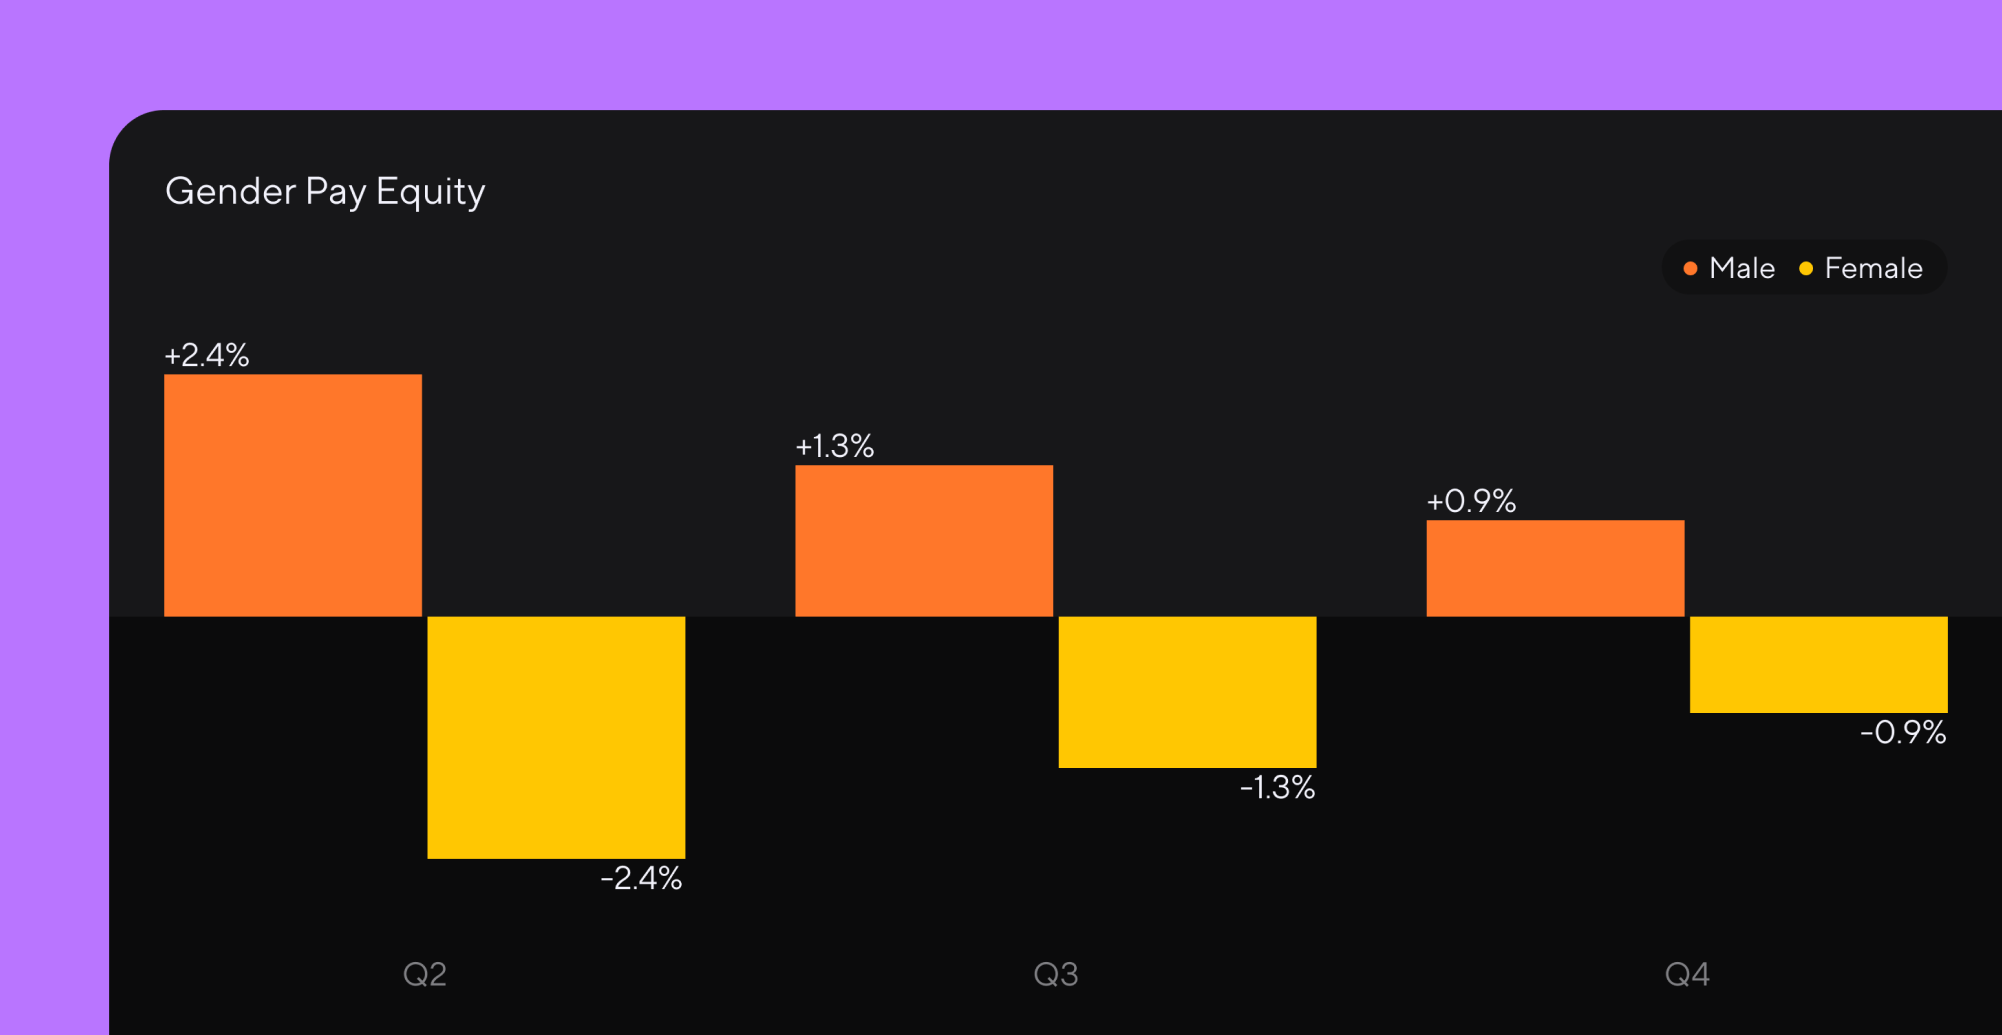
If the conversation about representation skews toward gender and race, the discourse around pay equity is overwhelmingly about gender.
The gender pay gap—on average women make 82 to 84.5 cents per every dollar men earn—persists and deserves attention, but so do other and often wider compensation gaps. Like the disability pay gap, for example. In 2022, individuals with a disability earned 42% less than those without, according to civil rights law firm Atticus.
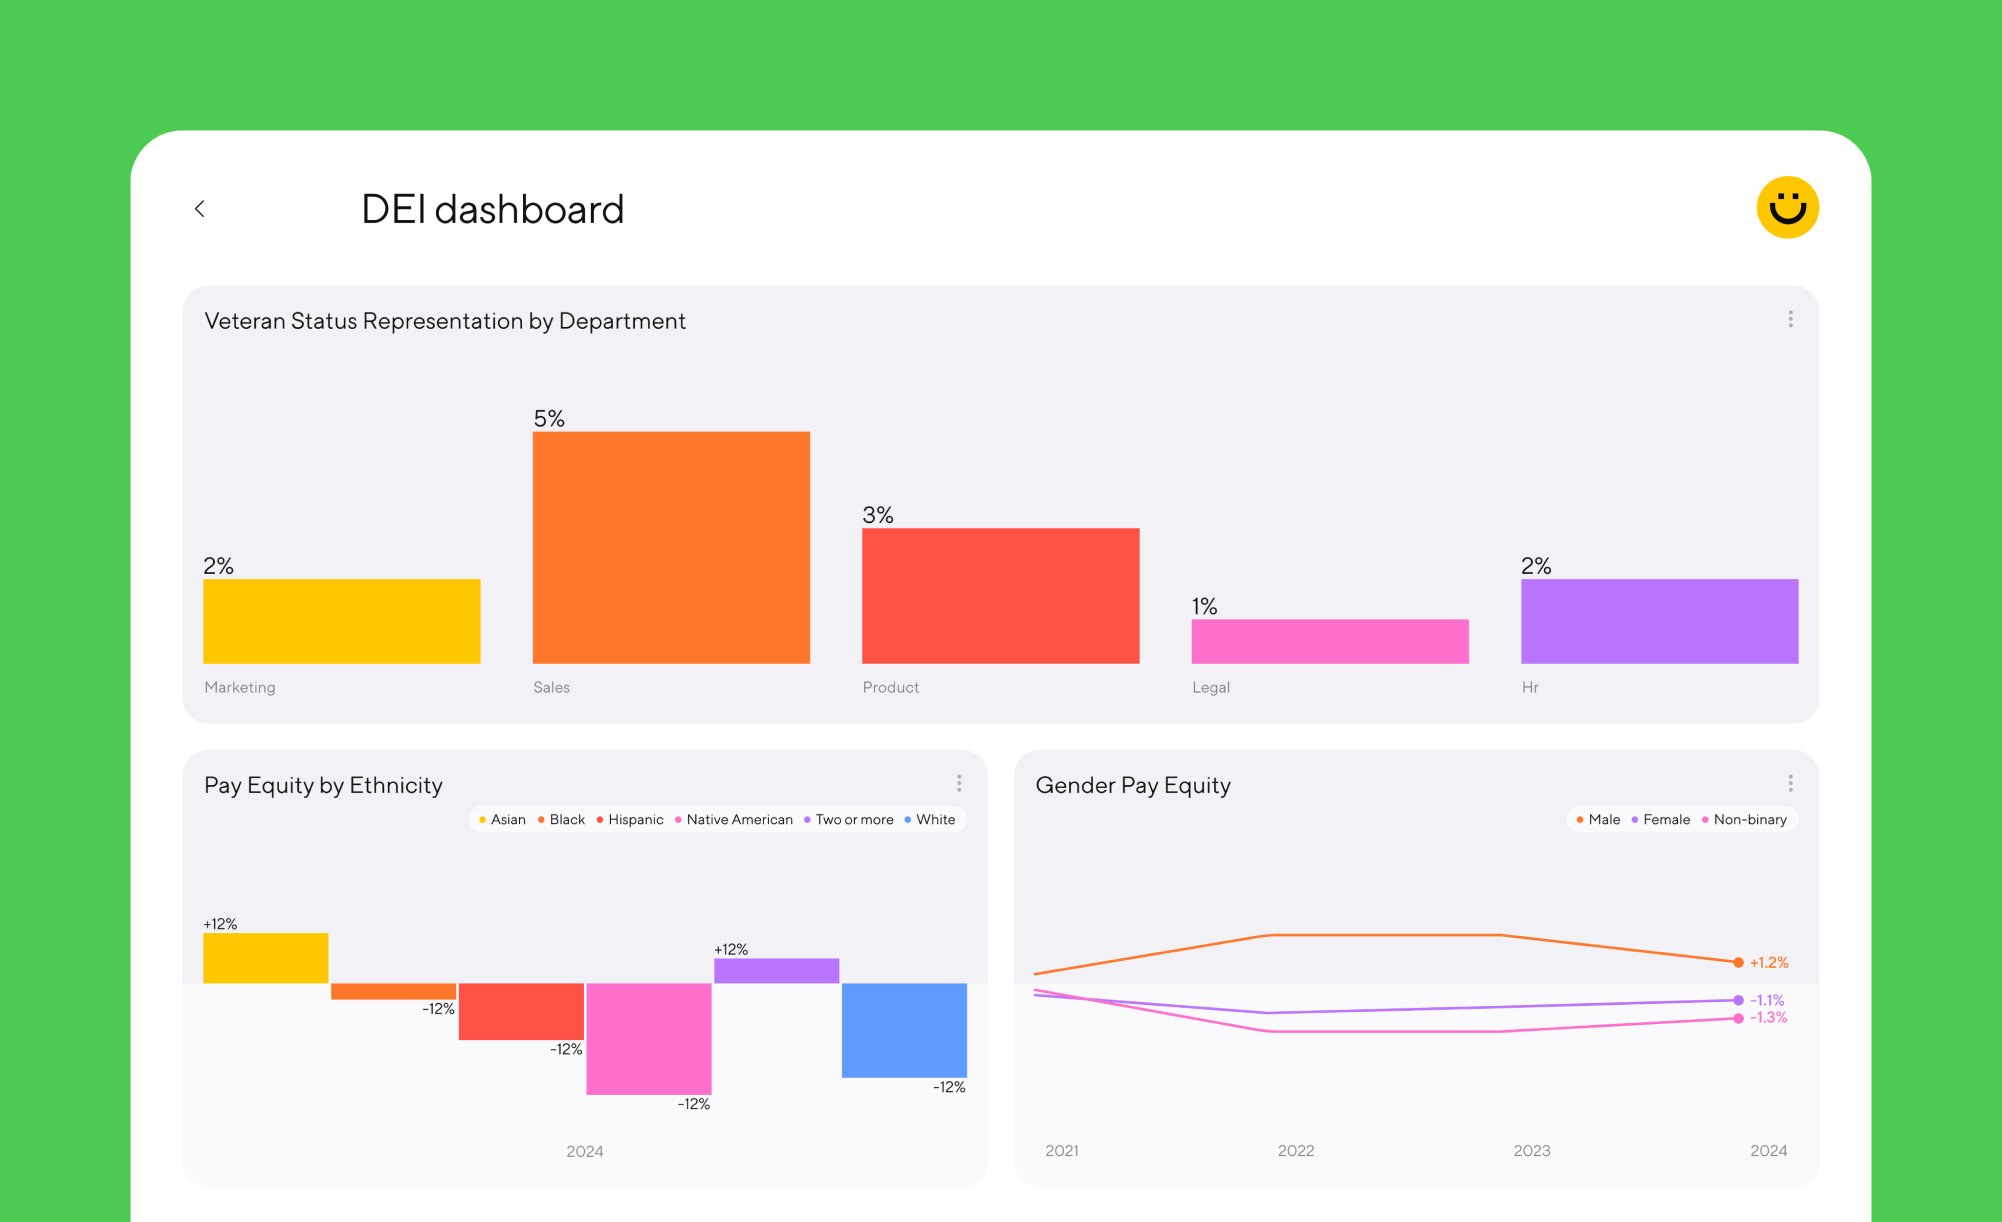
Companies should be tracking data across multiple demographic categories, like age, ethnicity, veteran status, neuro status, and gender.
For more revealing insights, cut the data by different departments, job levels, and even managers in the organization. Are there specific departments where pay gaps are wider than others? Does an over-representation of men in leadership positions skew your comp analysis?
Companies should be tracking pay data across multiple demographic categories, like age, ethnicity, veteran status, neuro status, and gender.
“Indian men are well represented in the C-suite across Silicon Valley, but that doesn’t mean there aren’t pay gaps for individuals of Indian descent at these same companies,” says Anu Mandapati, Global Head of Diversity at Magic Leap, an AR firm.
Tracking pay equity across different compensation categories will provide further granularity, too, so look at base pay, variable pay, bonuses, and total comp to glean more strategic insights. The first step to correcting for pay disparities is to be aware of them. By connecting dimensions of diversity to pay inequities, companies can implement strategies to move closer to pay parity.
Hiring, retention, and promotion
Companies eager to build more diverse and equitable workforces often focus on hiring. Since we’re not meeting our diversity metrics, the thinking goes, we need more diverse folks in the door.
To be sure, this is a necessary first step, but just because you hire people doesn’t mean they’ll stay. Companies need to ensure they’re also retaining and promoting folks along the way.
Consider the case of Intel in the mid 2010s. The company was among the first in tech to publish their diversity metrics but quickly realized that sharing the numbers didn’t amount to meaningful change. In 2015 they came up with a five-year DEI plan to reach “full representation” by 2020, and put up $300 million to make it happen. Only one year and tens of millions of dollars later, they weren’t any closer. What happened? While Intel had exceeded their hiring goals, the tech giant failed to retain employees from the same groups it was trying to attract.
Companies need data that tells them who they’re hiring, who they’re promoting, and how long they’re staying to build DEI strategies with lasting impact.
Hiring
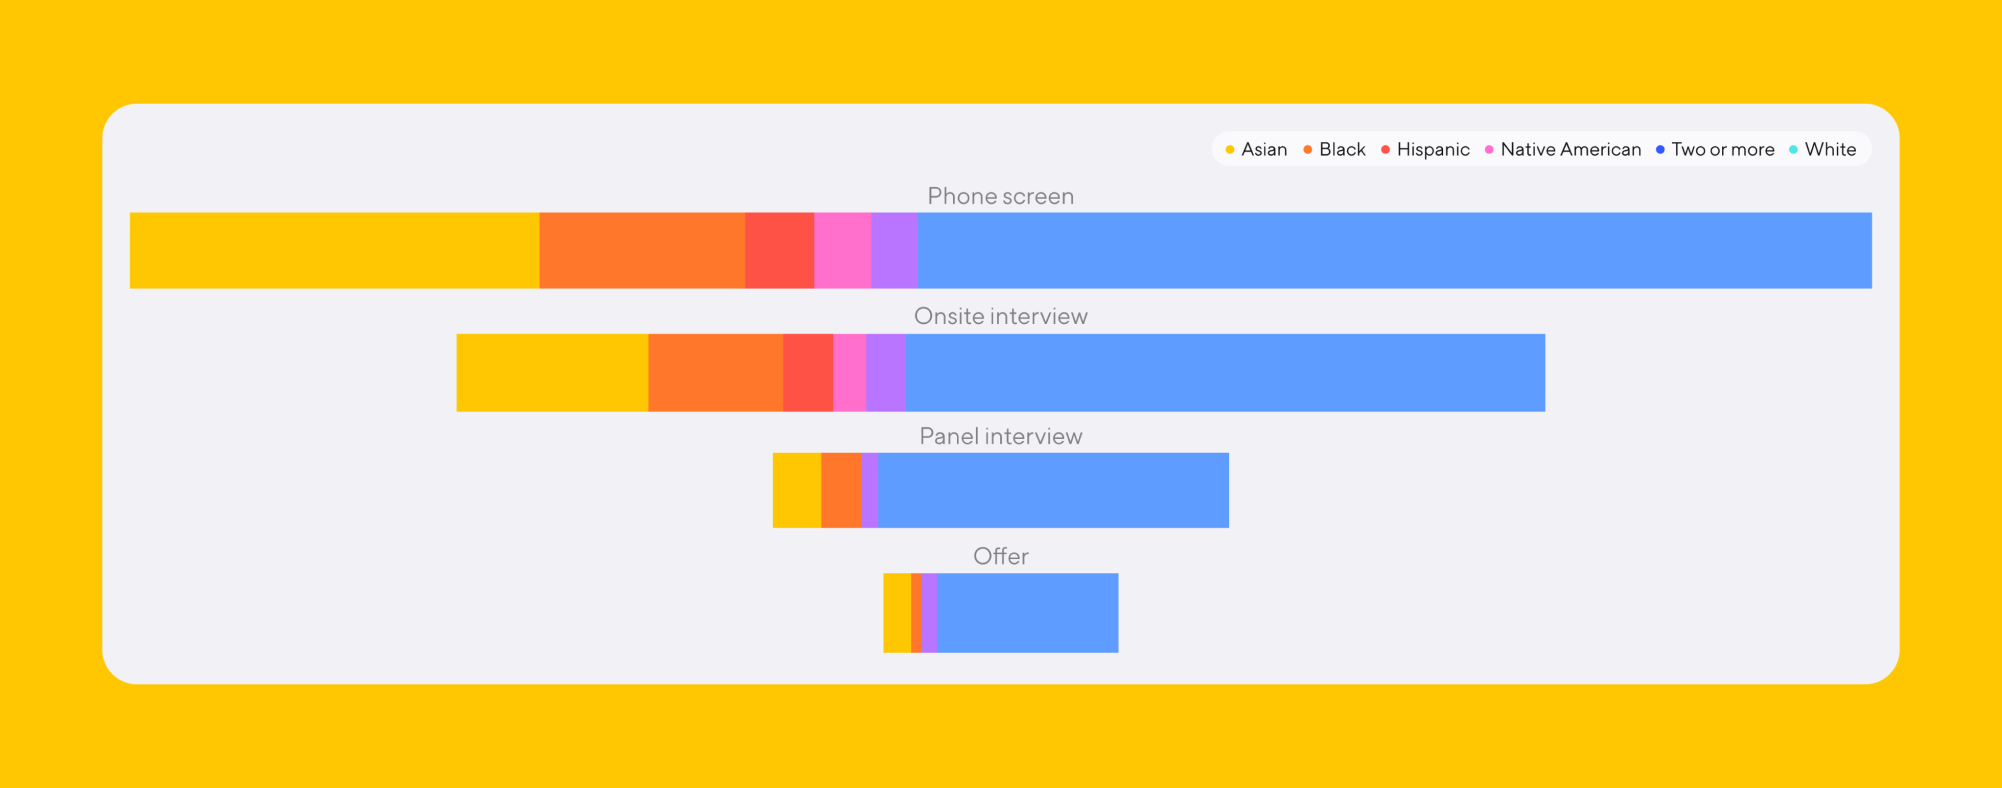
Hiring is the foundation for building a more diverse workforce, but companies often focus on the recruiting pipeline and less on how candidates move through the recruiting funnel.
“You want to look at where diverse folks are coming in from and also where you’re losing them in the process,” Colman says. “Companies often don’t do enough digging: are you losing them after their in-person [interview], is there a specific manager or department where folks fall out earlier or later in the process, is there a recruiter who’s not sourcing as diversely as others?” she adds.
Retention
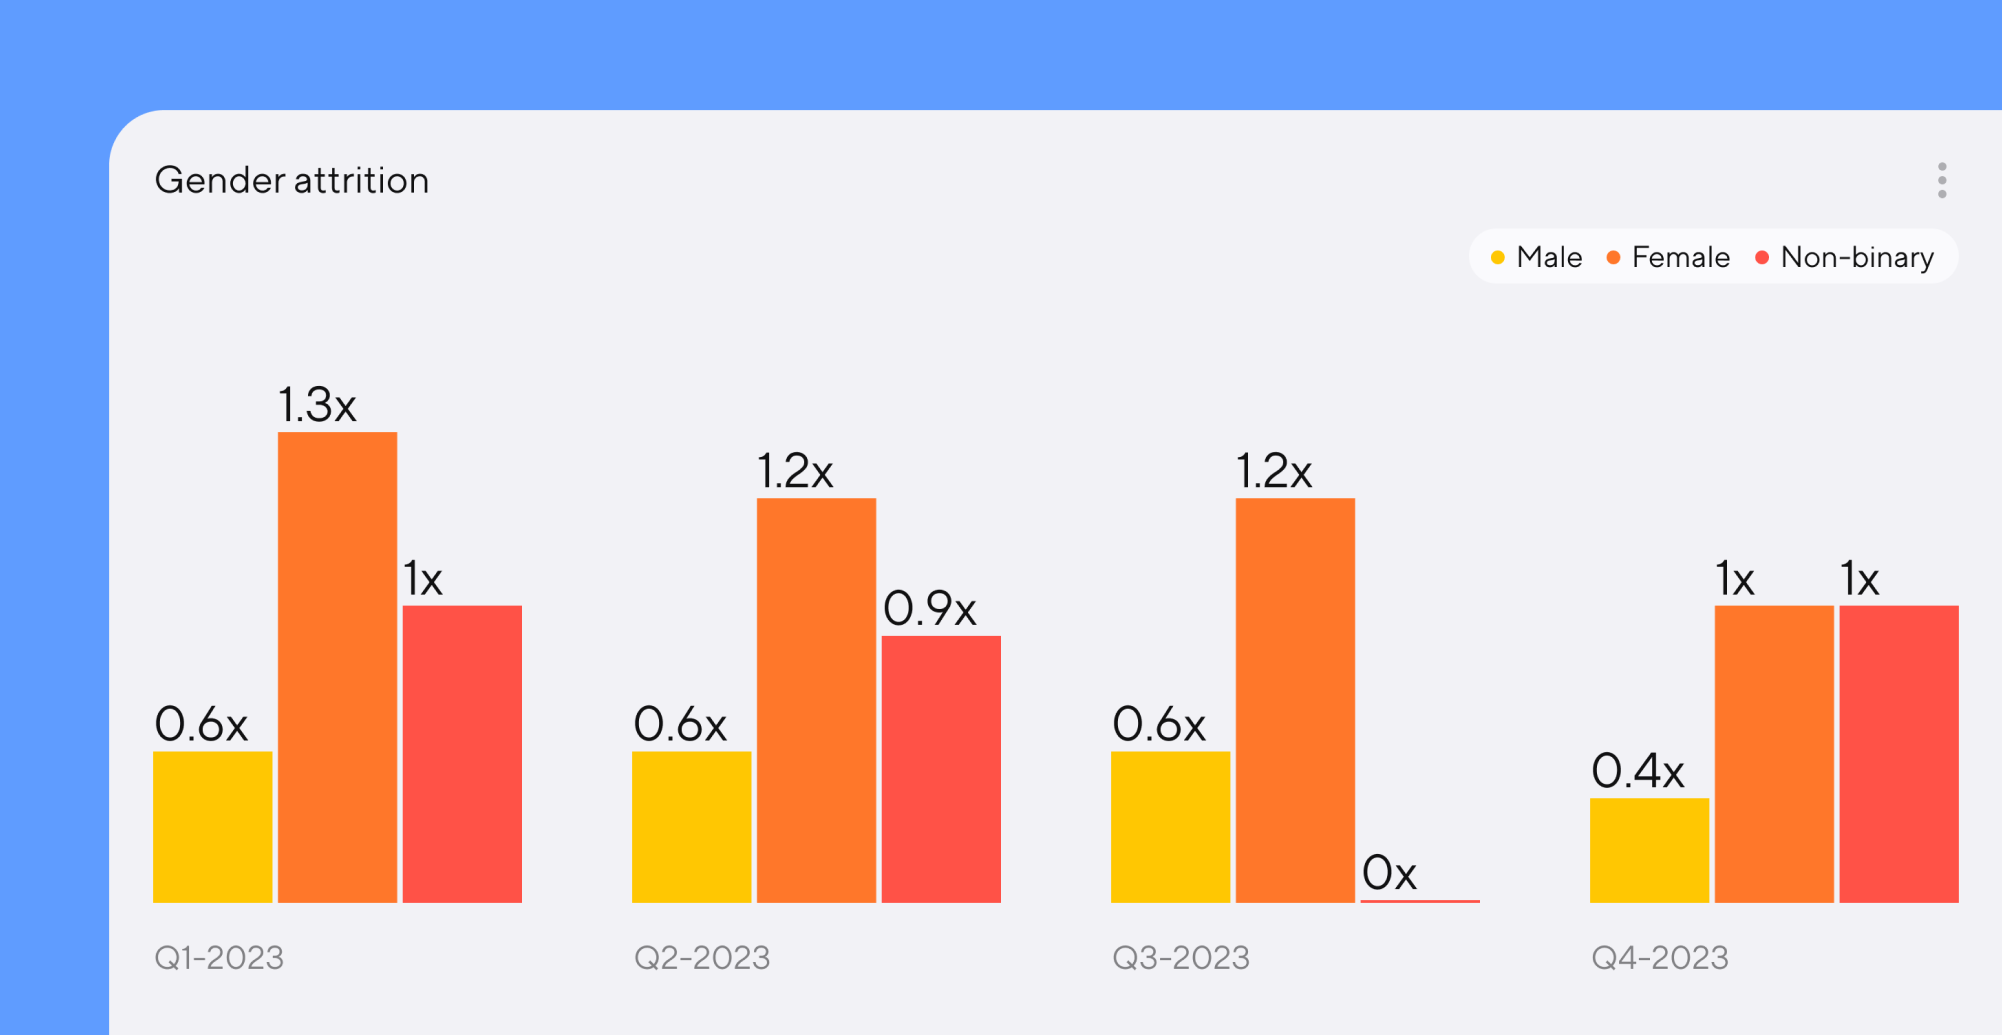
Retaining great people is essential for every business. Tenured employees are settled in their role and have institutional knowledge, but retention rates can vary widely across different groups of employees. “You want to know people’s reasons for leaving and if that data shows up differently across different dimensions of diversity,” Mandapati says.
Tracking retention by demographics reveals gaps in your retention strategy, allowing you to drive more targeted solutions, like recommitting resources to employee resource groups (ERGs), creating a sponsorship program, or launching an employee-listening campaign.
Comparing your retention data against other data from the employee journey will allow for more unique insights. “Retention [data] is especially important, and companies want to cut the data by manager, by department, and look at promotion rates, among others,” says Colman. “Cross-reference retention data against the other data you have to understand the whole story that the data tells you,” she adds.
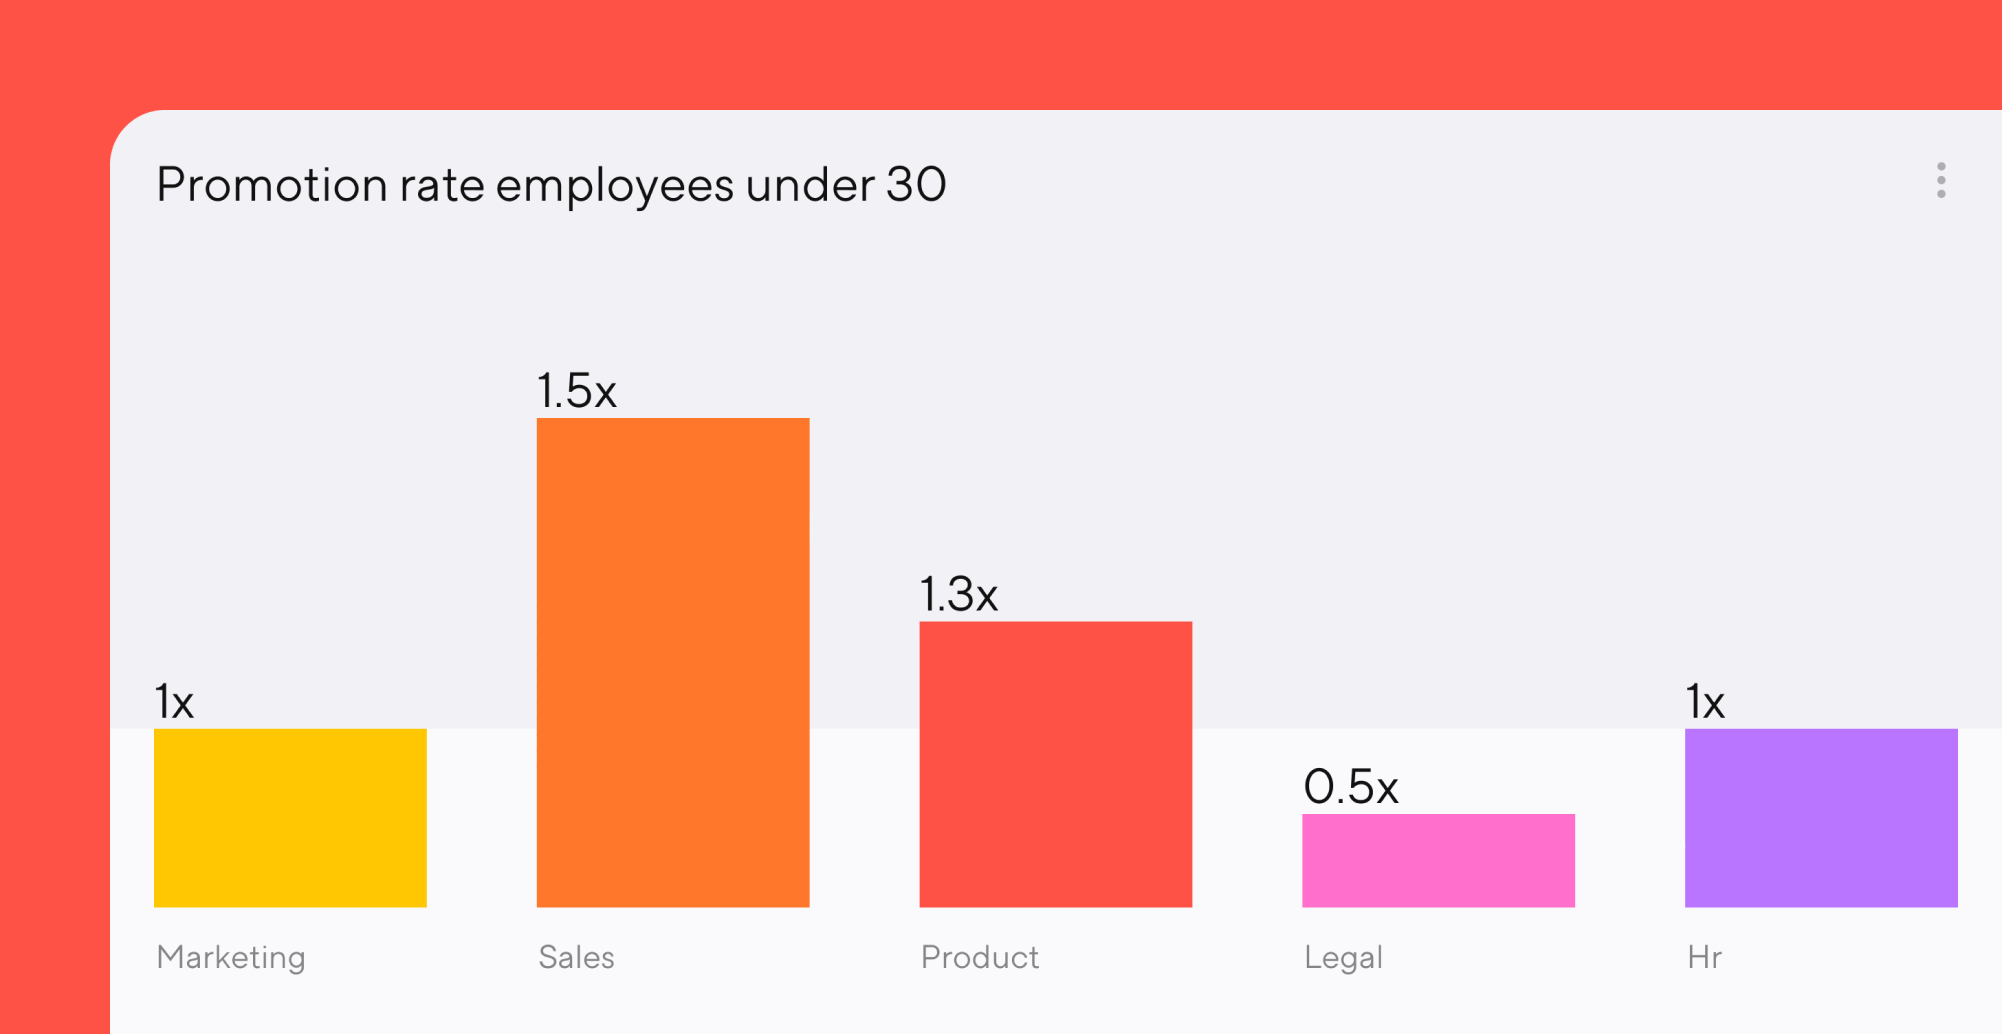
Promotion
Who you promote and when has a huge effect on your DEI efforts. The longer people stay, the more they earn, and the higher they climb in the corporate ranks—all powerful levers for advancing many core DEI goals.
In Getting to Diversity, Dobbin and Kalev use the diversity of managers as their key diversity metric. Why? “If you see managers who are women and people of color, that means the company not only recruits entry-level workers from different backgrounds but keeps them around and creates an environment in which they can flourish,” they write.
Yet all too often, this isn’t the case; companies don’t do a good job of retaining and then promoting women or people of color. Data from Statista finds that women and men are hired as new associates at equal rates across law firms, yet fewer than a quarter of “equity partners were women in 2021.”
If promotions are competitive and harder to come by at your organization, that’s ok—but should be true across identity groups. “As a company it’s important to be clear about the expectation of promotion. Maybe it is a little harder to move up the ranks for whatever reason, but that same data percentage should track across all demographics,” Colman says.
Ensuring equitable access to promotion opportunities and eliminating opportunity gaps starts with tracking the right data. Look for promotion rates by the various diversity dimensions, but also by department, manager, and performance. The patterns you see across one demographic or variable should bear out across others.
Track more data for better DEI insights
Despite pushback and the threat of legal action, DEI programming remains strong at many companies. For those doing the work, the key now is to do it even better. For that, you need to be tracking more than ethnicity and gender at your organization. Dandi makes it easy to track intersectional data across your organization so you can unearth insights and drive better to hit your DEI goals.
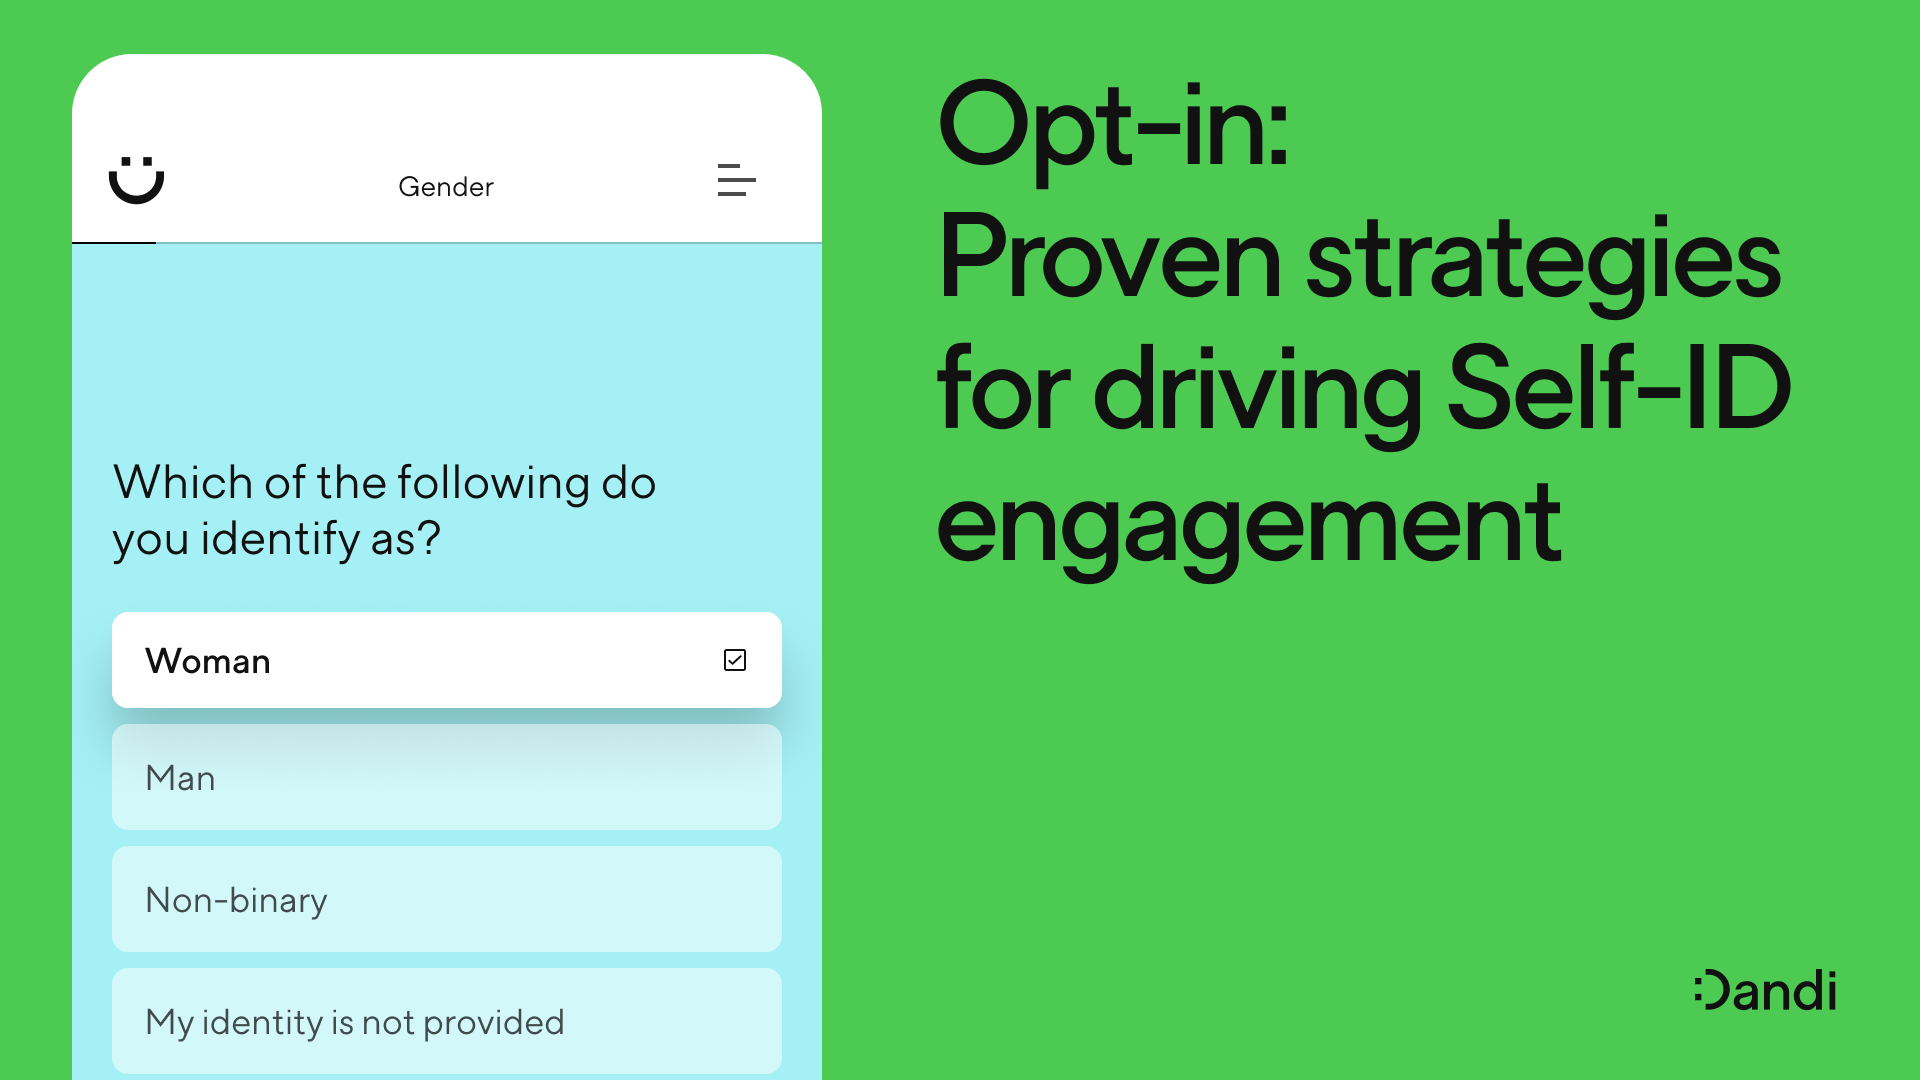
Get the essential people data that better insights are built on. Check out the Dandi guide to self-ID campaigns.
More from the blog
Announcing more powerful Dandi data visualizations
Team Dandi - Oct 23rd, 2024
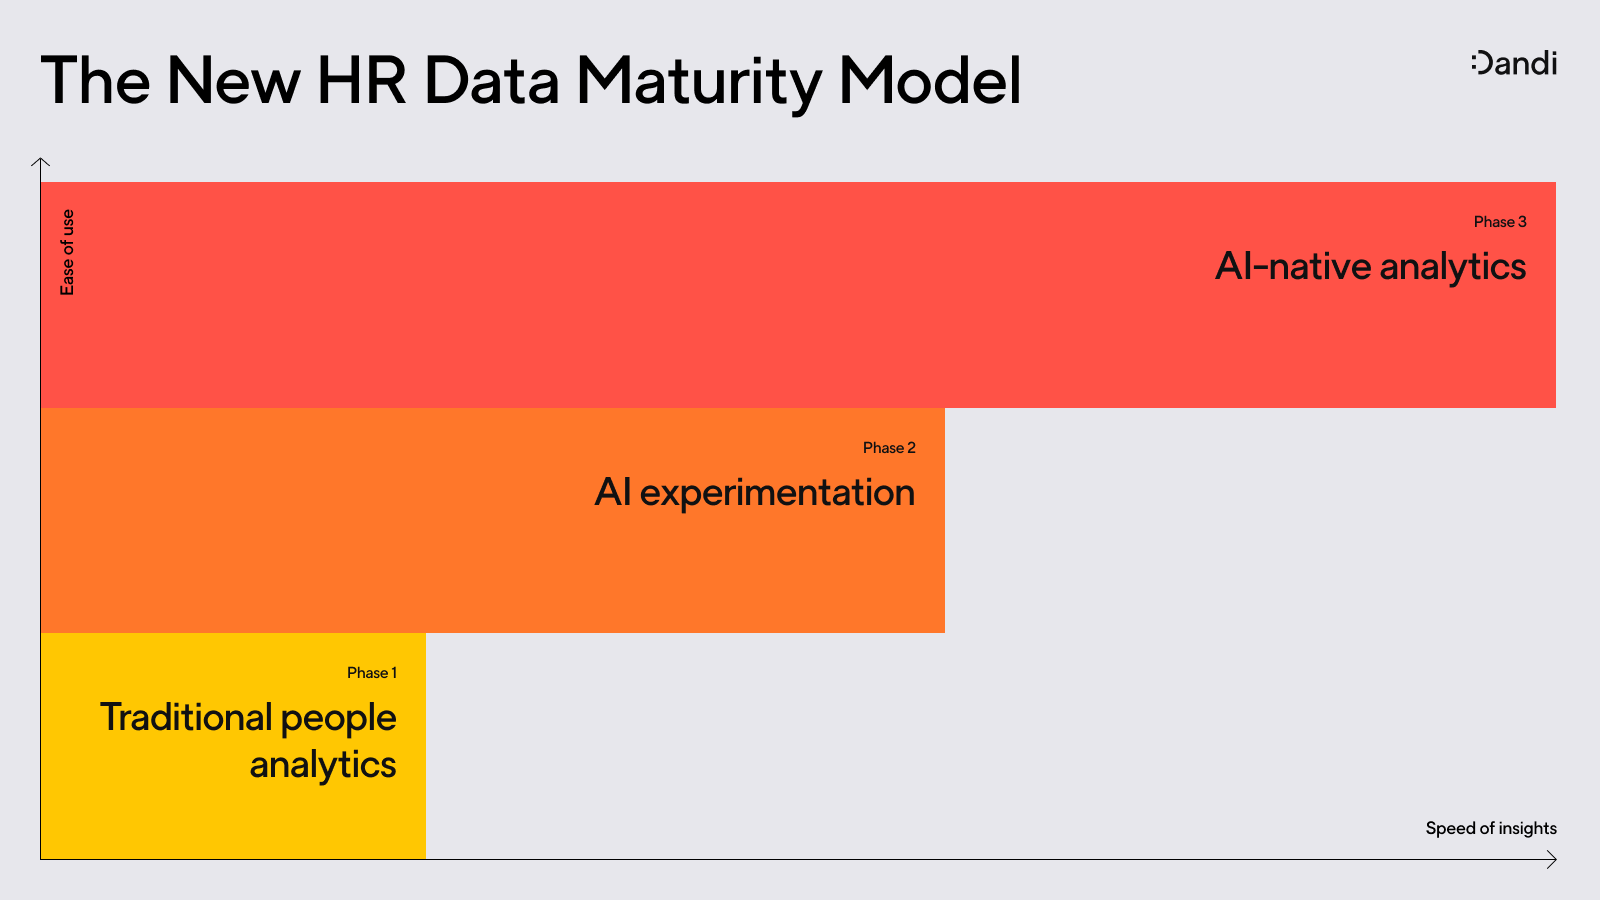
The New Maturity Model for HR Data
Catherine Tansey - Sep 5th, 2024
Buyer’s Guide: AI for HR Data
Catherine Tansey - Jul 24th, 2024
Powerful people insights, 3X faster
Team Dandi - Jun 18th, 2024
Dandi Insights: In-Person vs. Remote
Catherine Tansey - Jun 10th, 2024
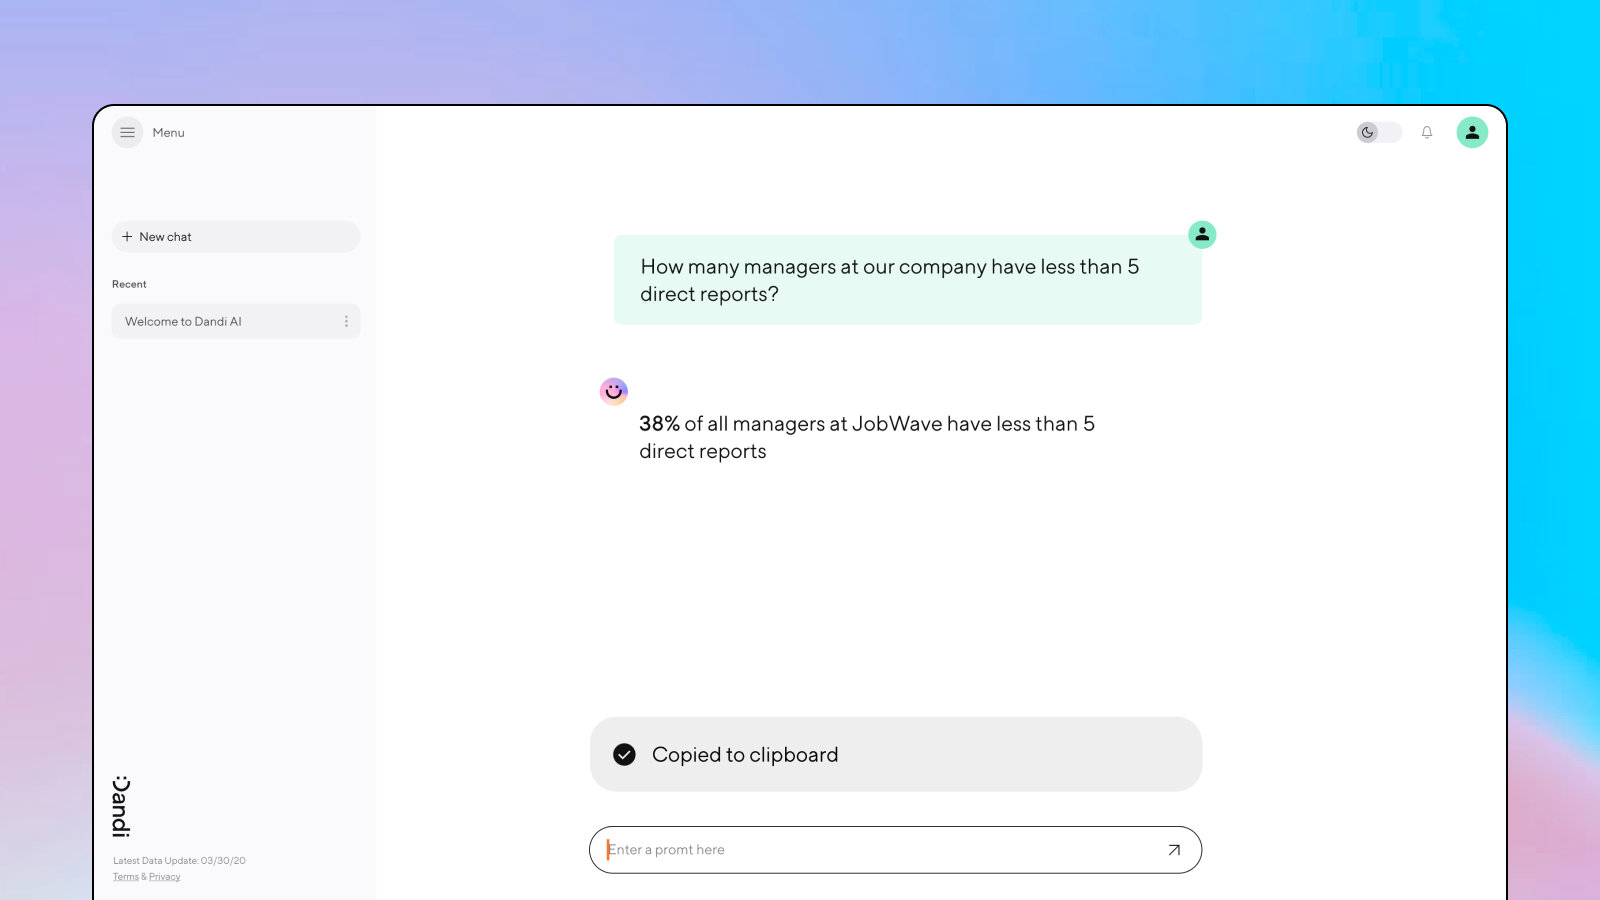
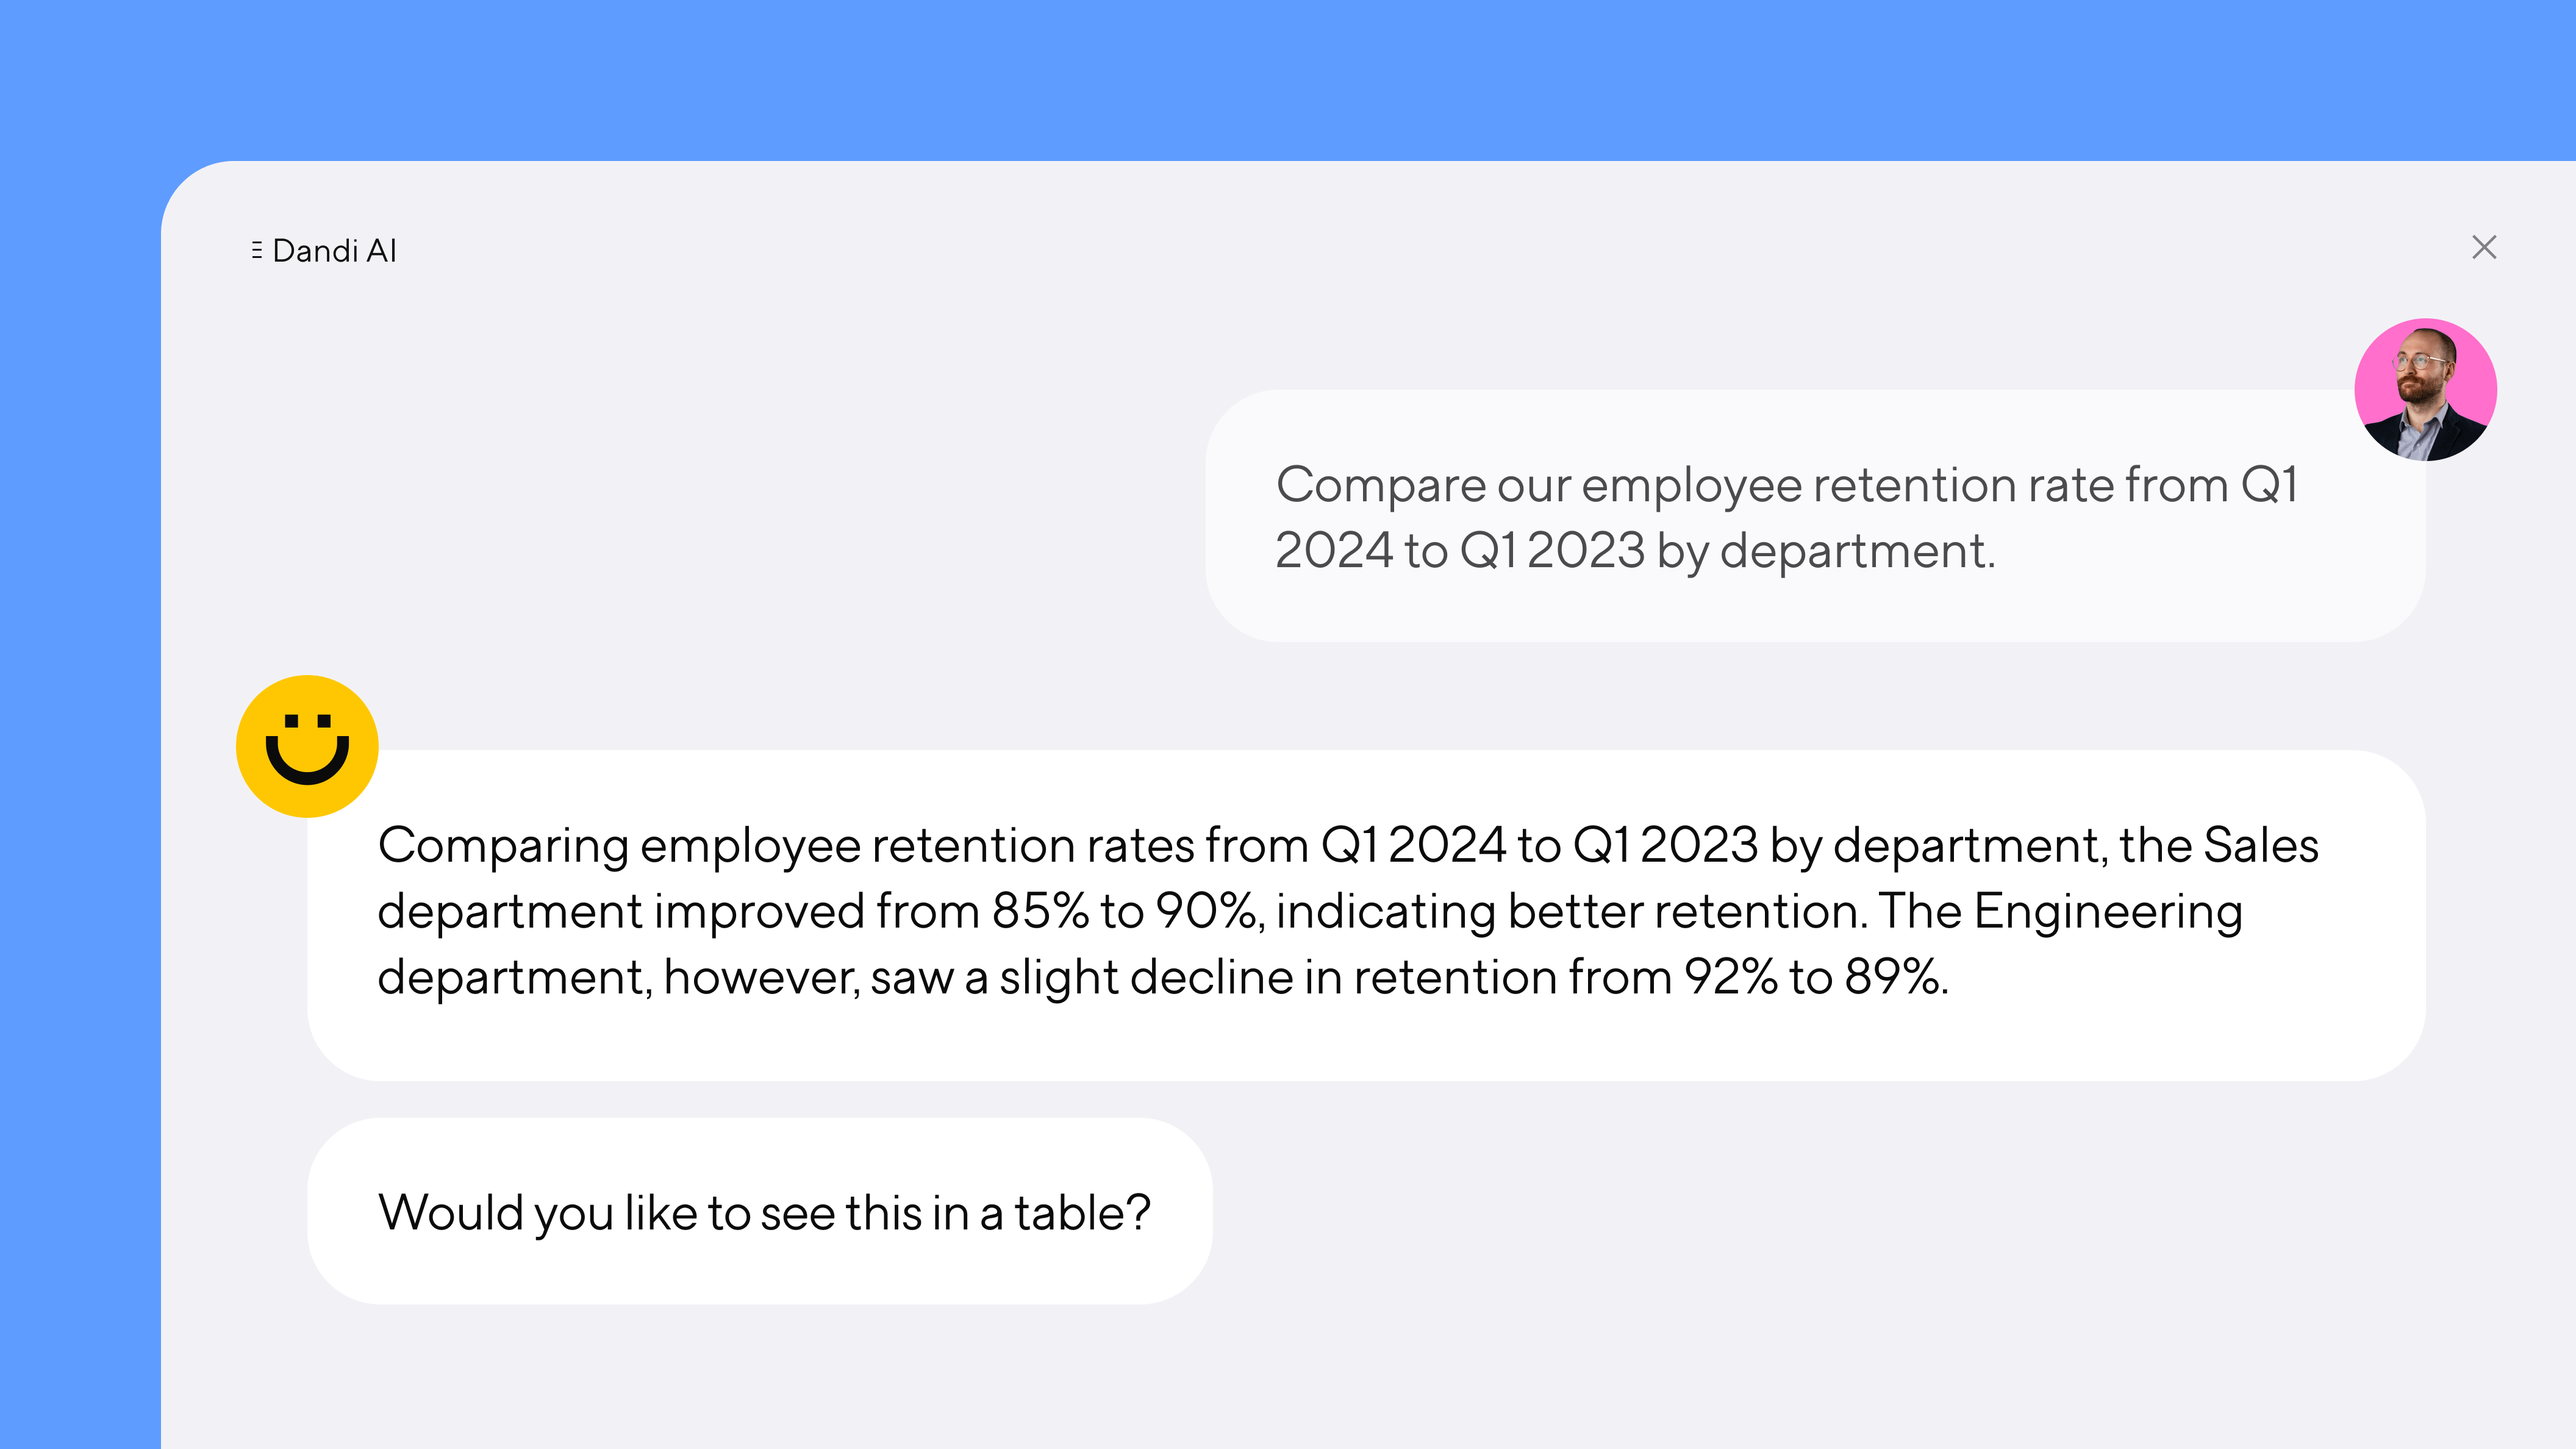
Introducing Dandi AI for HR Data
Team Dandi - May 22nd, 2024
5 essential talent and development dashboards
Catherine Tansey - May 1st, 2024
The people data compliance checklist
Catherine Tansey - Apr 17th, 2024
5 essential EX dashboards
Catherine Tansey - Apr 10th, 2024
Proven strategies for boosting engagement in self-ID campaigns
Catherine Tansey - Mar 27th, 2024