Benchmarking
See how your company measures up against others with Dandi's built-in benchmarking.
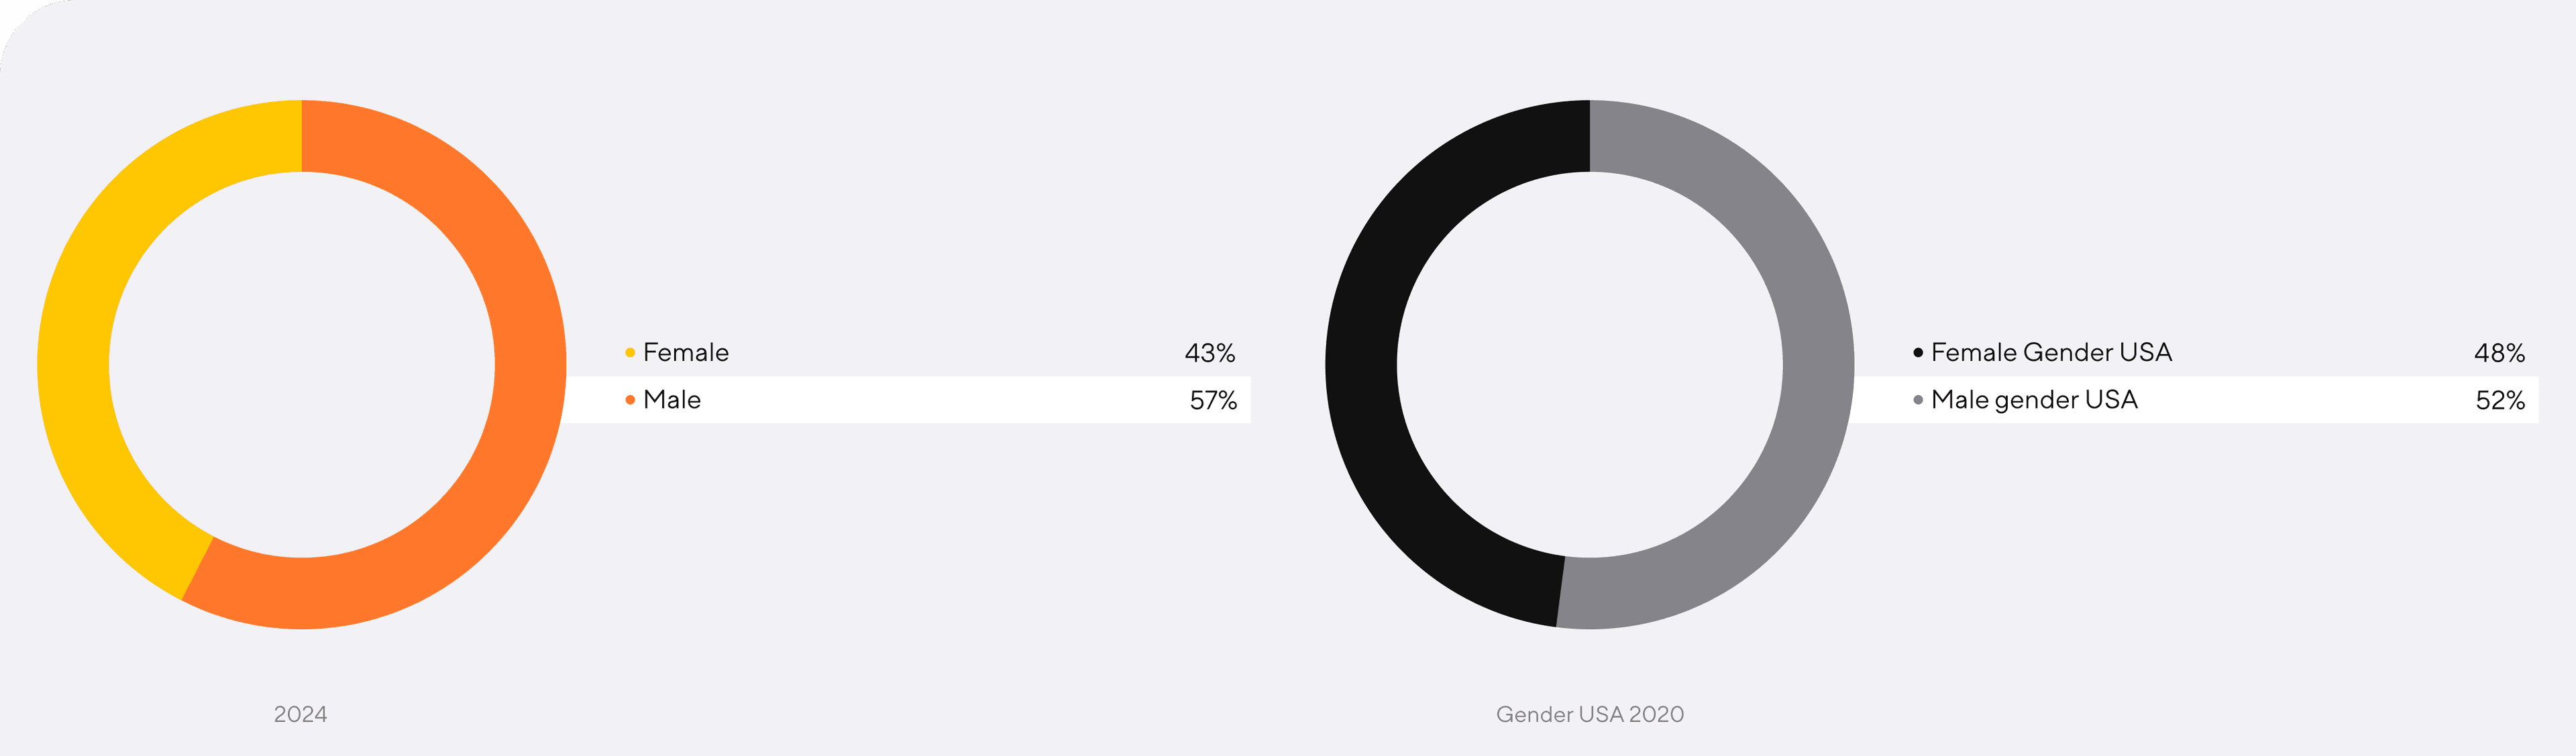
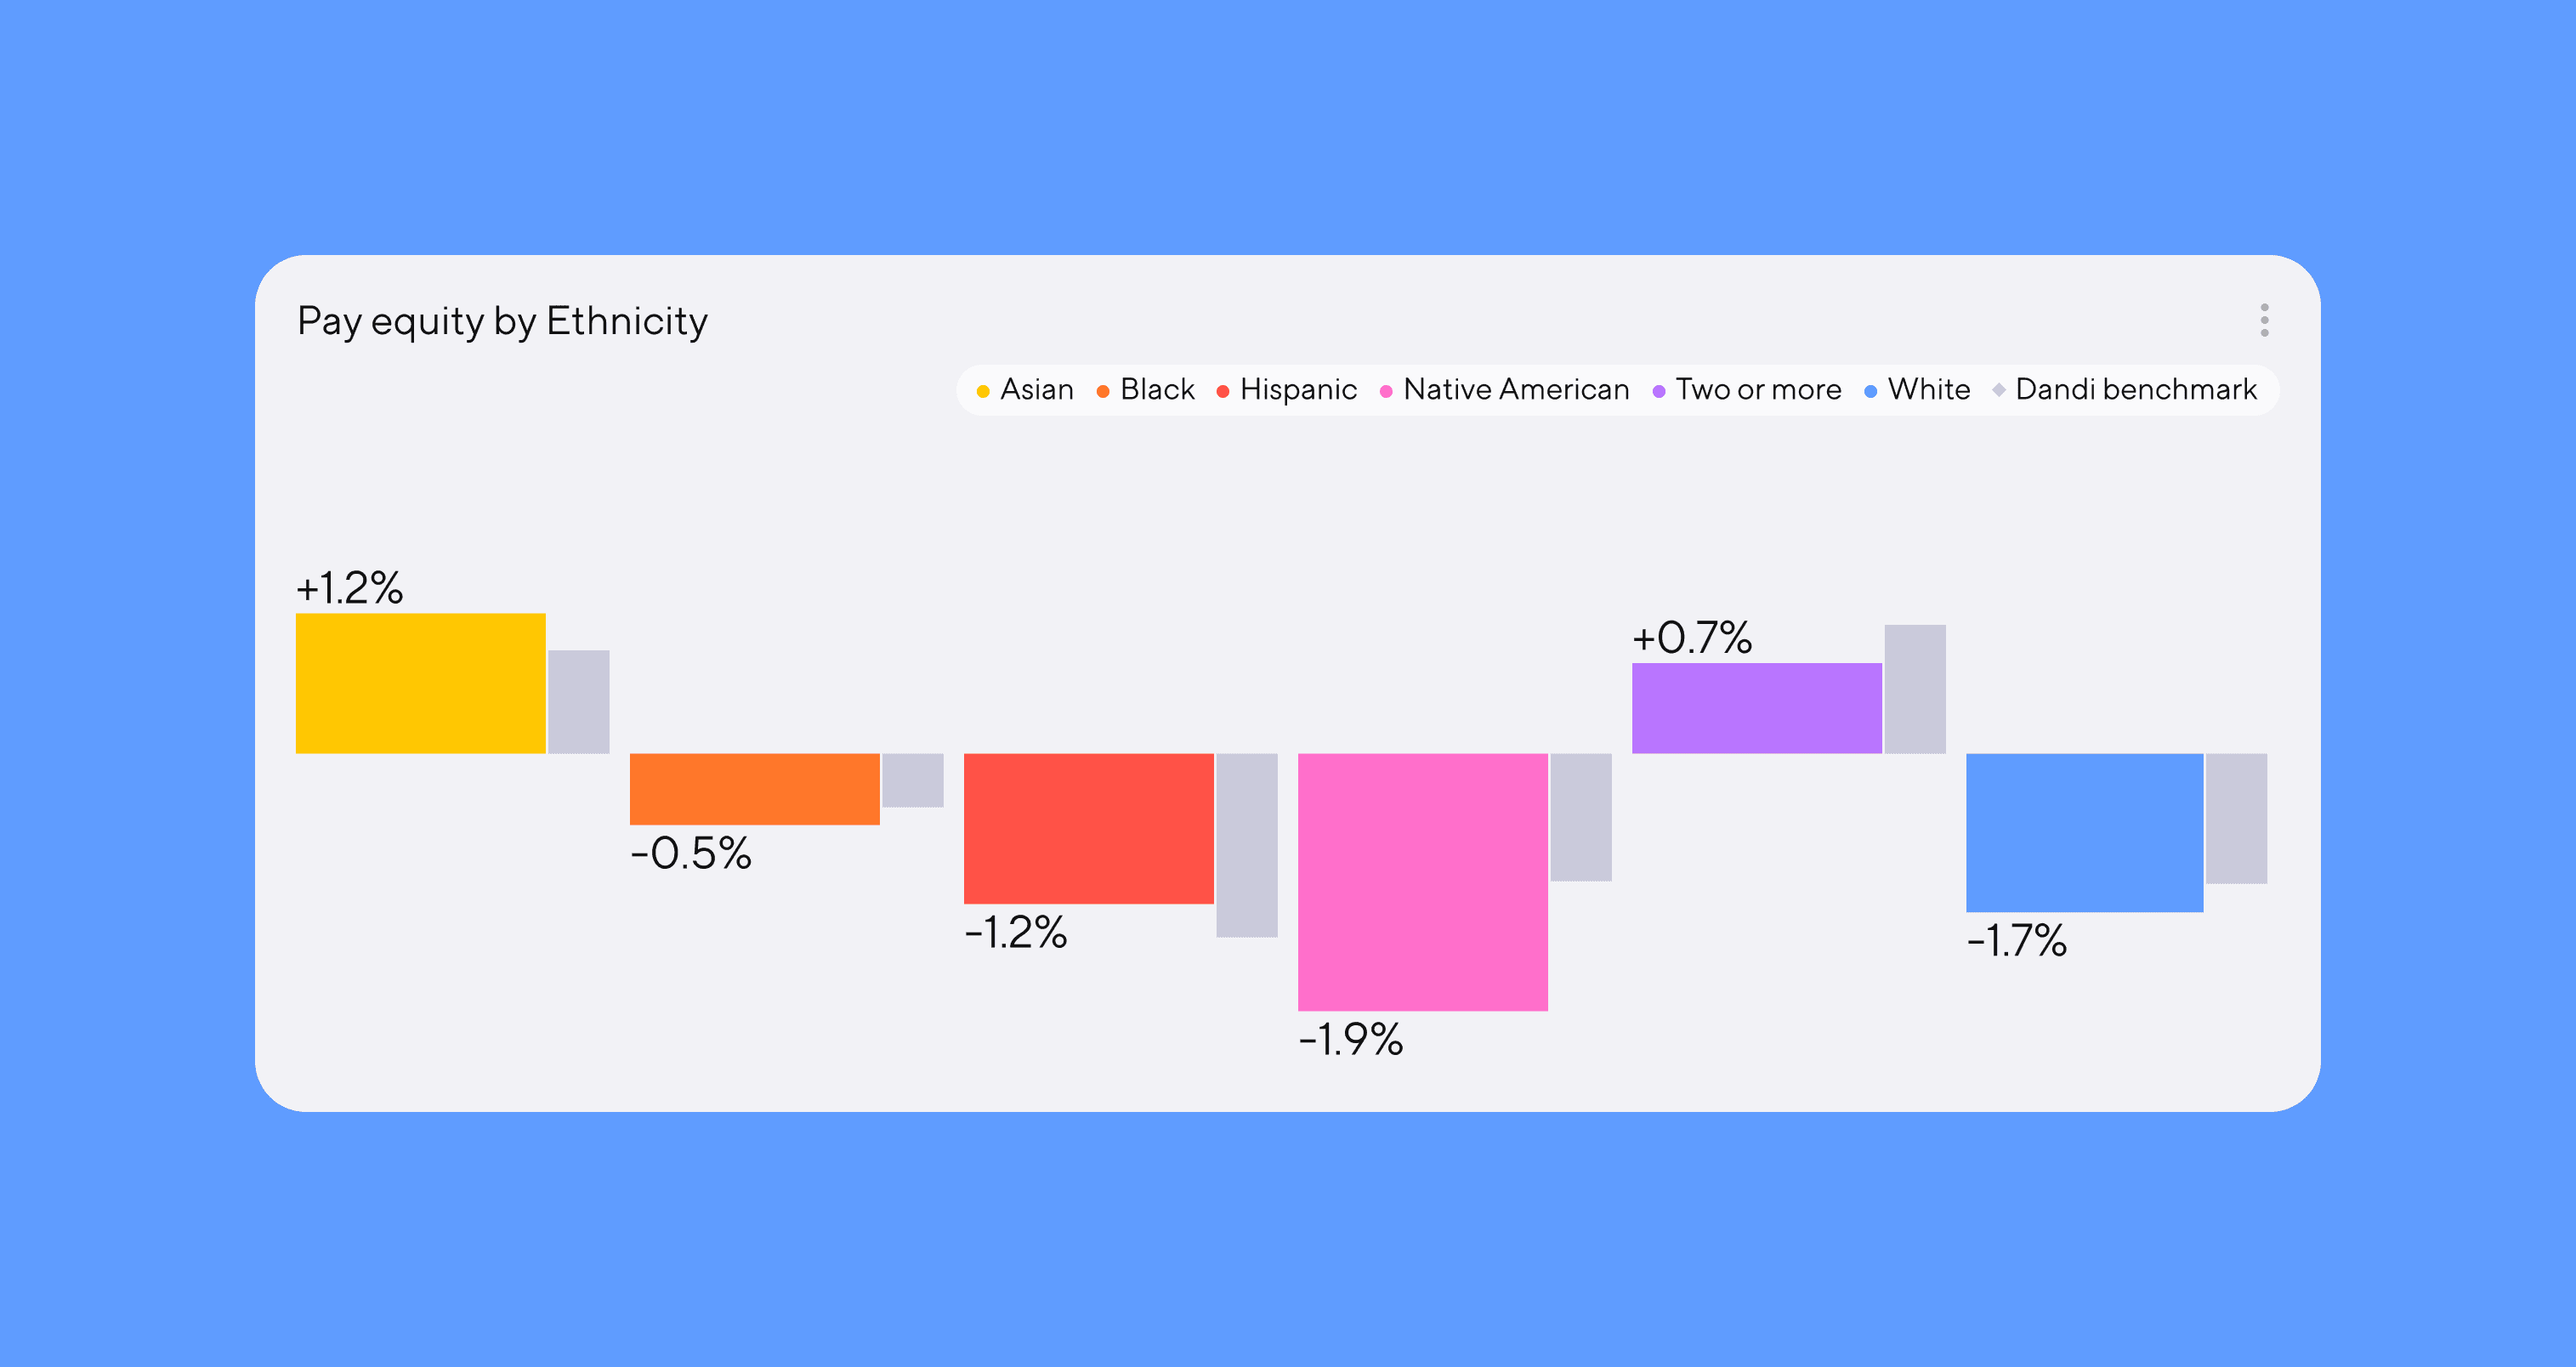
Leverage the latest EEOC dataDandi benchmarking uses EEOC data, the largest, most complete set of workforce data collected to date, allowing you to compare your data to other businesses across Industry, Gender, Ethnicity, and Location.
Benchmarking for DEI
Use Dandi benchmarking to tailor your DEI strategies to identified gaps and goals.
- Unlock strategic opportunitiesBetter understand workforce trends in your industry and locations to identify resource opportunities and areas of differentiation.
- Answer compliance questions Ensure your organization is in compliance with federal laws.
- Add custom data setsDandi has the ability to ingest any external data set for benchmarking.
Unlock strategic opportunitiesBetter understand workforce trends in your industry and locations to identify resource opportunities and areas of differentiation.
Coming soon: benchmark against Dandi data
We’re working on a benchmarking dataset comprised from our own aggregated, anonymized customer data.
Case study
Oscar Health
With Dandi, Oscar Health set a new benchmark for company-wide transparency.
The first step toward improving is knowing where you stand.
Kerel CooperPresident of Advertising, Group Black